Overview
The Problem
In the US, there has always been an issue with car idling that contributed to a significant amount of greenhouse gas emissions. From both heavy-duty and light-duty vehicles, the combined fuel waste due to idling is estimated to be 6 billion gallons a year. Looking at personal vehicles specifically, there are more than 30 million tons of CO2 generated annually just by idling (U.S. Department of Energy).
The research conducted by Inrix shows that traffic signals, specifically in cities, are also a significant contributor to greenhouse gas emissions (Edelstein, 2022). In a city with a lot of stop-and-go traffic, the amount of emissions generated by idling is significant.
Initial Design Question
How can we effectively increase people’s awareness of car idling and reduce car idling time for all vehicles in King County in order to create a low-carbon future?
Research
Secondary Research
US Department of Energy: “Idling Reduction for Personal Vehicles”
“Researchers estimate that idling from heavy-duty and light-duty vehicles combined wastes about 6 billion gallons of fuel annually. About half of that is attributable to personal vehicles, which generate around 30 million tons of CO2 every year just by idling.”
“While the impact of idling may be small on a per-car basis, the impact of the 250 million personal vehicles in the U.S. adds up.
“For saving fuel and reducing emissions, eliminating the unnecessary idling of personal vehicles would be the same as taking 5 million vehicles off the roads.”
In King County
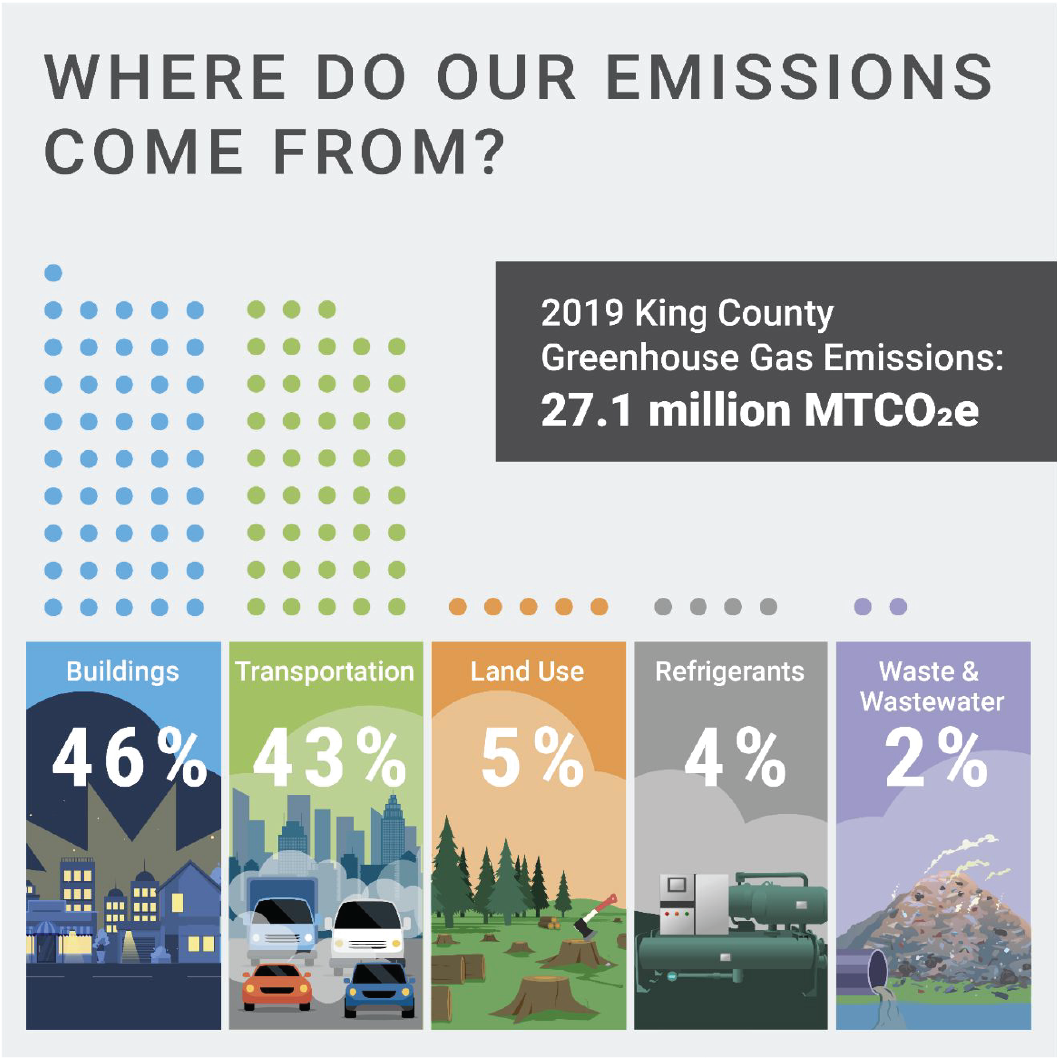
Around 43% of Greenhouse Gas Emissions are from transportation
Second largest emission, 3% less than building electricity consumption
In the US
Car Idling wastes 6 billion gallons of gasoline annually
Traffic Red Light contributes to the car idling time significantly
Existing (potential) Solutions
MIT News: “Better traffic signals can cut greenhouse gas emissions”
A study conducted by MIT researchers showed that there are better ways to program a traffic light to “reduce delays, improve efficiency, and reduce emissions”.
Government Policy: Laws that will fine people when idling over a certain amount of time.
New York City: The New York City Administrative Code, Title 24, Section 24-163
“No person should allow the engine of a motor vehicle to idle for longer than three minutes while parking, standing, or stopping.”
Auto-start Technology: A vehicle Auto-start system automatically shuts down and restarts the internal combustion engine to reduce the amount of time the engine spends idling, thereby reducing fuel consumption and emissions.
Reflections
After a few rounds of research, we realized that a big percentage of Green House Gas emissions come from car idling while waiting for the traffic lights.
There are basically two different types of car idling, controllable and uncontrollable. For instance, Uber, Lyft, taxis, buses, and school buses will be considered uncontrollable car idling; personal vehicles are generally controllable. We now have a clearer direction, focusing on reducing car idling time for personal vehicles.
There are some potential solutions to help solve the car idling issue, but why aren’t they working? Where is a product that can really reduce personal vehicle idling time? How helpful is the Auto-start Technology?
Revised Design Question:
How can we effectively reduce car idling time and its Greenhouse Gas emissions when waiting for traffic lights — a problem that is often overlooked — to all personal vehicles in King County in order to create a low-carbon future?
Filed Research
After conducting the secondary research, we were able to refine the design question so that we could target a more specific set of users.
For this field study, we are targeting personal vehicles specifically within the King County area. Narrowing the target users helped us to identify and focus on the key elements that we are observing in the field studies. Before our field studies, we identified six areas of focus that we wanted to learn more about. These areas include Surrounding Environment, Tools and Technology, Demographics, Traffic, Information, Communication Access, and Overall Experience.
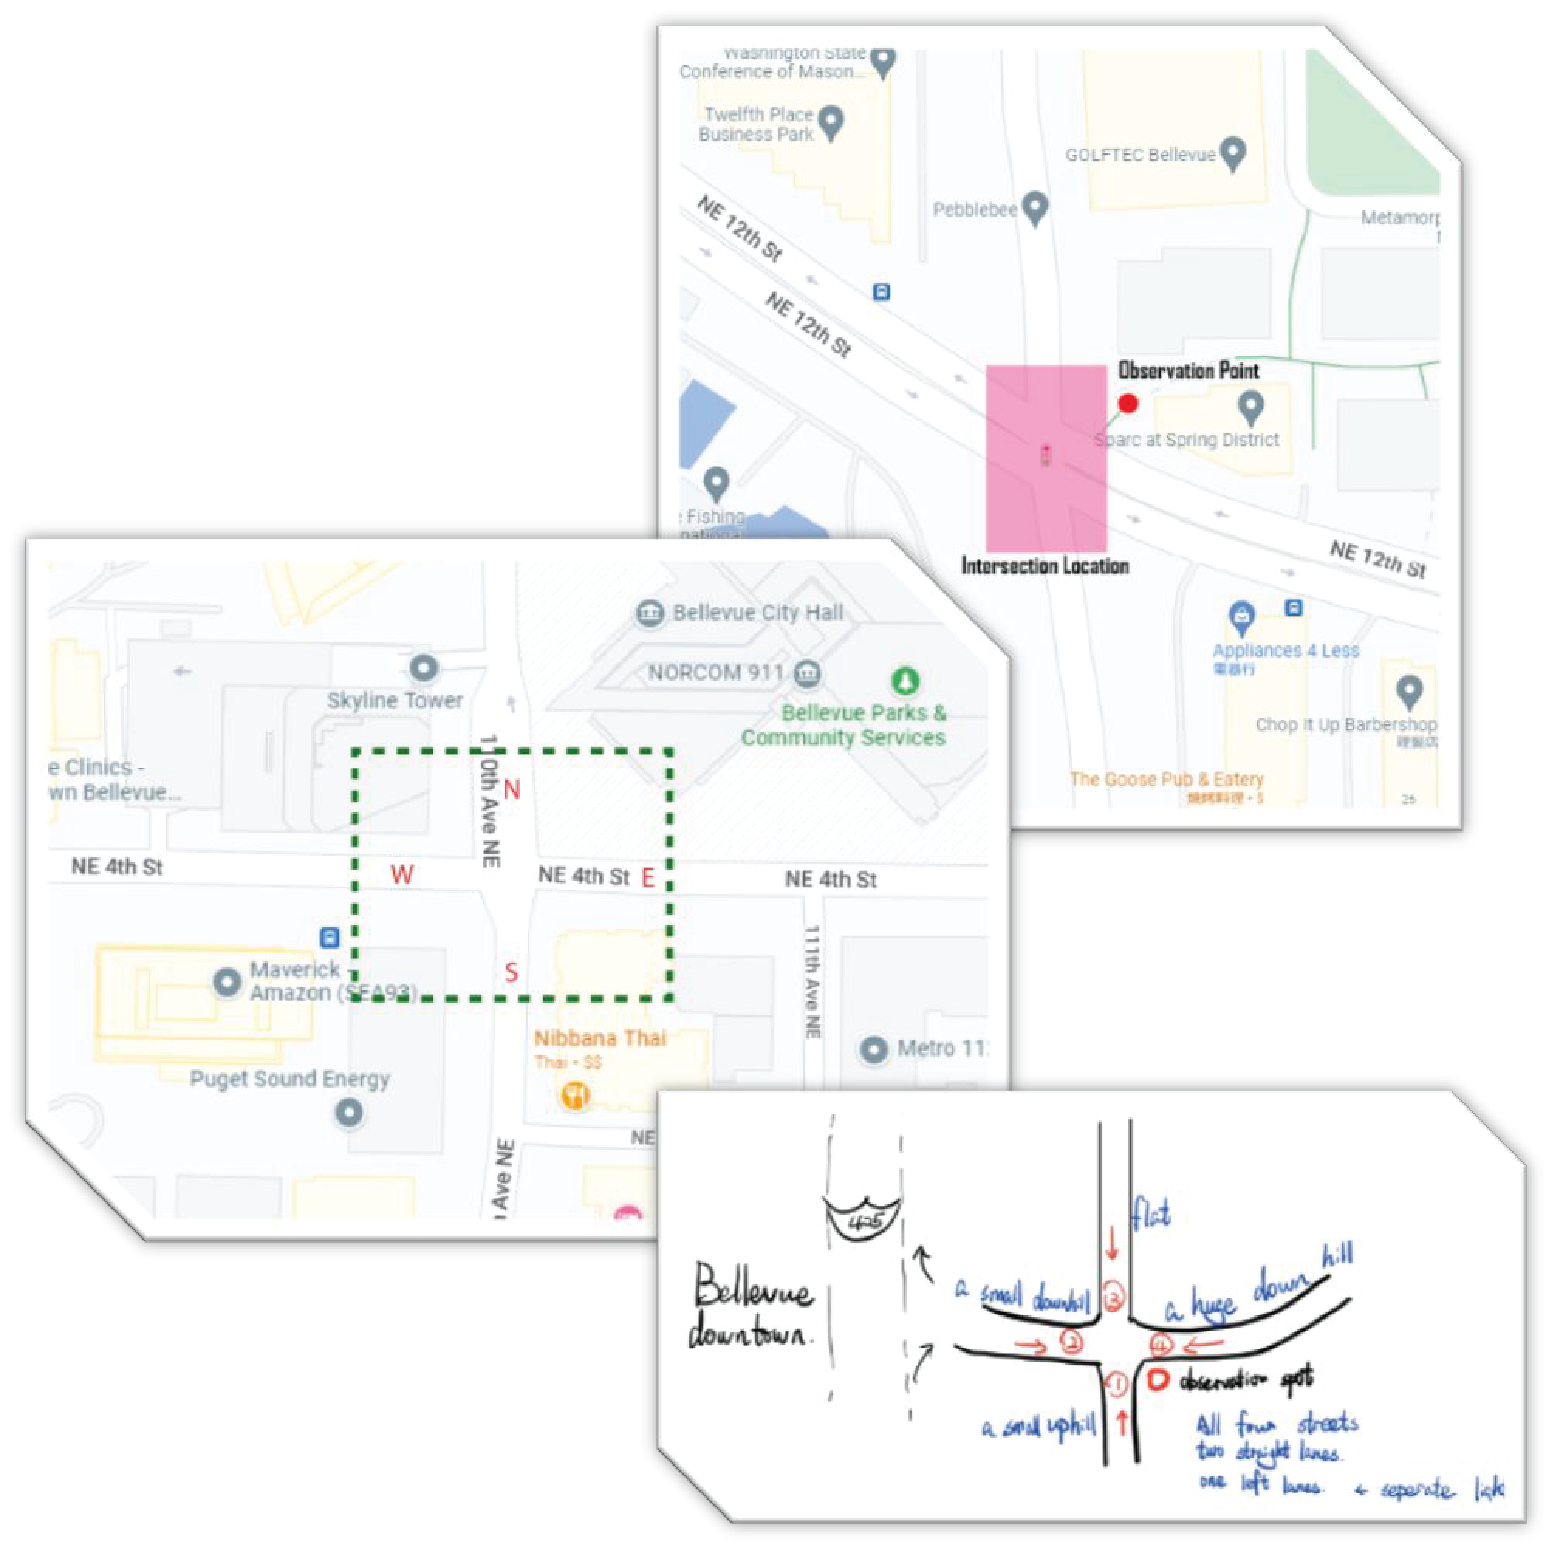
Each of the members conducted one field study that is located at three different street intersections in King County. Based on the feedback from the instructor, we chose the same time frame for all three observations so that it would be consistent. In each location, we sat down for 30 minutes and took notes of the cars passing through. We made observations based on the focal points we identified beforehand so that we could focus on what we wanted to look at.
Condition
Three different intersections in King County
Same time frame
Analysis
Most people are driving their cars with auto-start disabled.
Most people do nothing when waiting for the traffic light.
All three intersections don’t have signs that encourage drivers to turn off their engines at the red light.
Red lights’ wait times are all different.
Reflections
From the field research, we learned a lot about users' behavior when waiting for the traffic light.
In the beginning, we were hoping that most of the drivers would be using their phones so that we could potentially design some interactions in the app to alert drivers to turn off the engines. But the truth is, only a small percentage of the drivers used their phones at the red light.
Through this field research, we confirmed our direction, focusing on the ways to avoid red lights for drivers, and alert them about the red light remaining time maybe using audio instead of visuals so that they feel comfortable turning off the car engine temporarily.
Survey
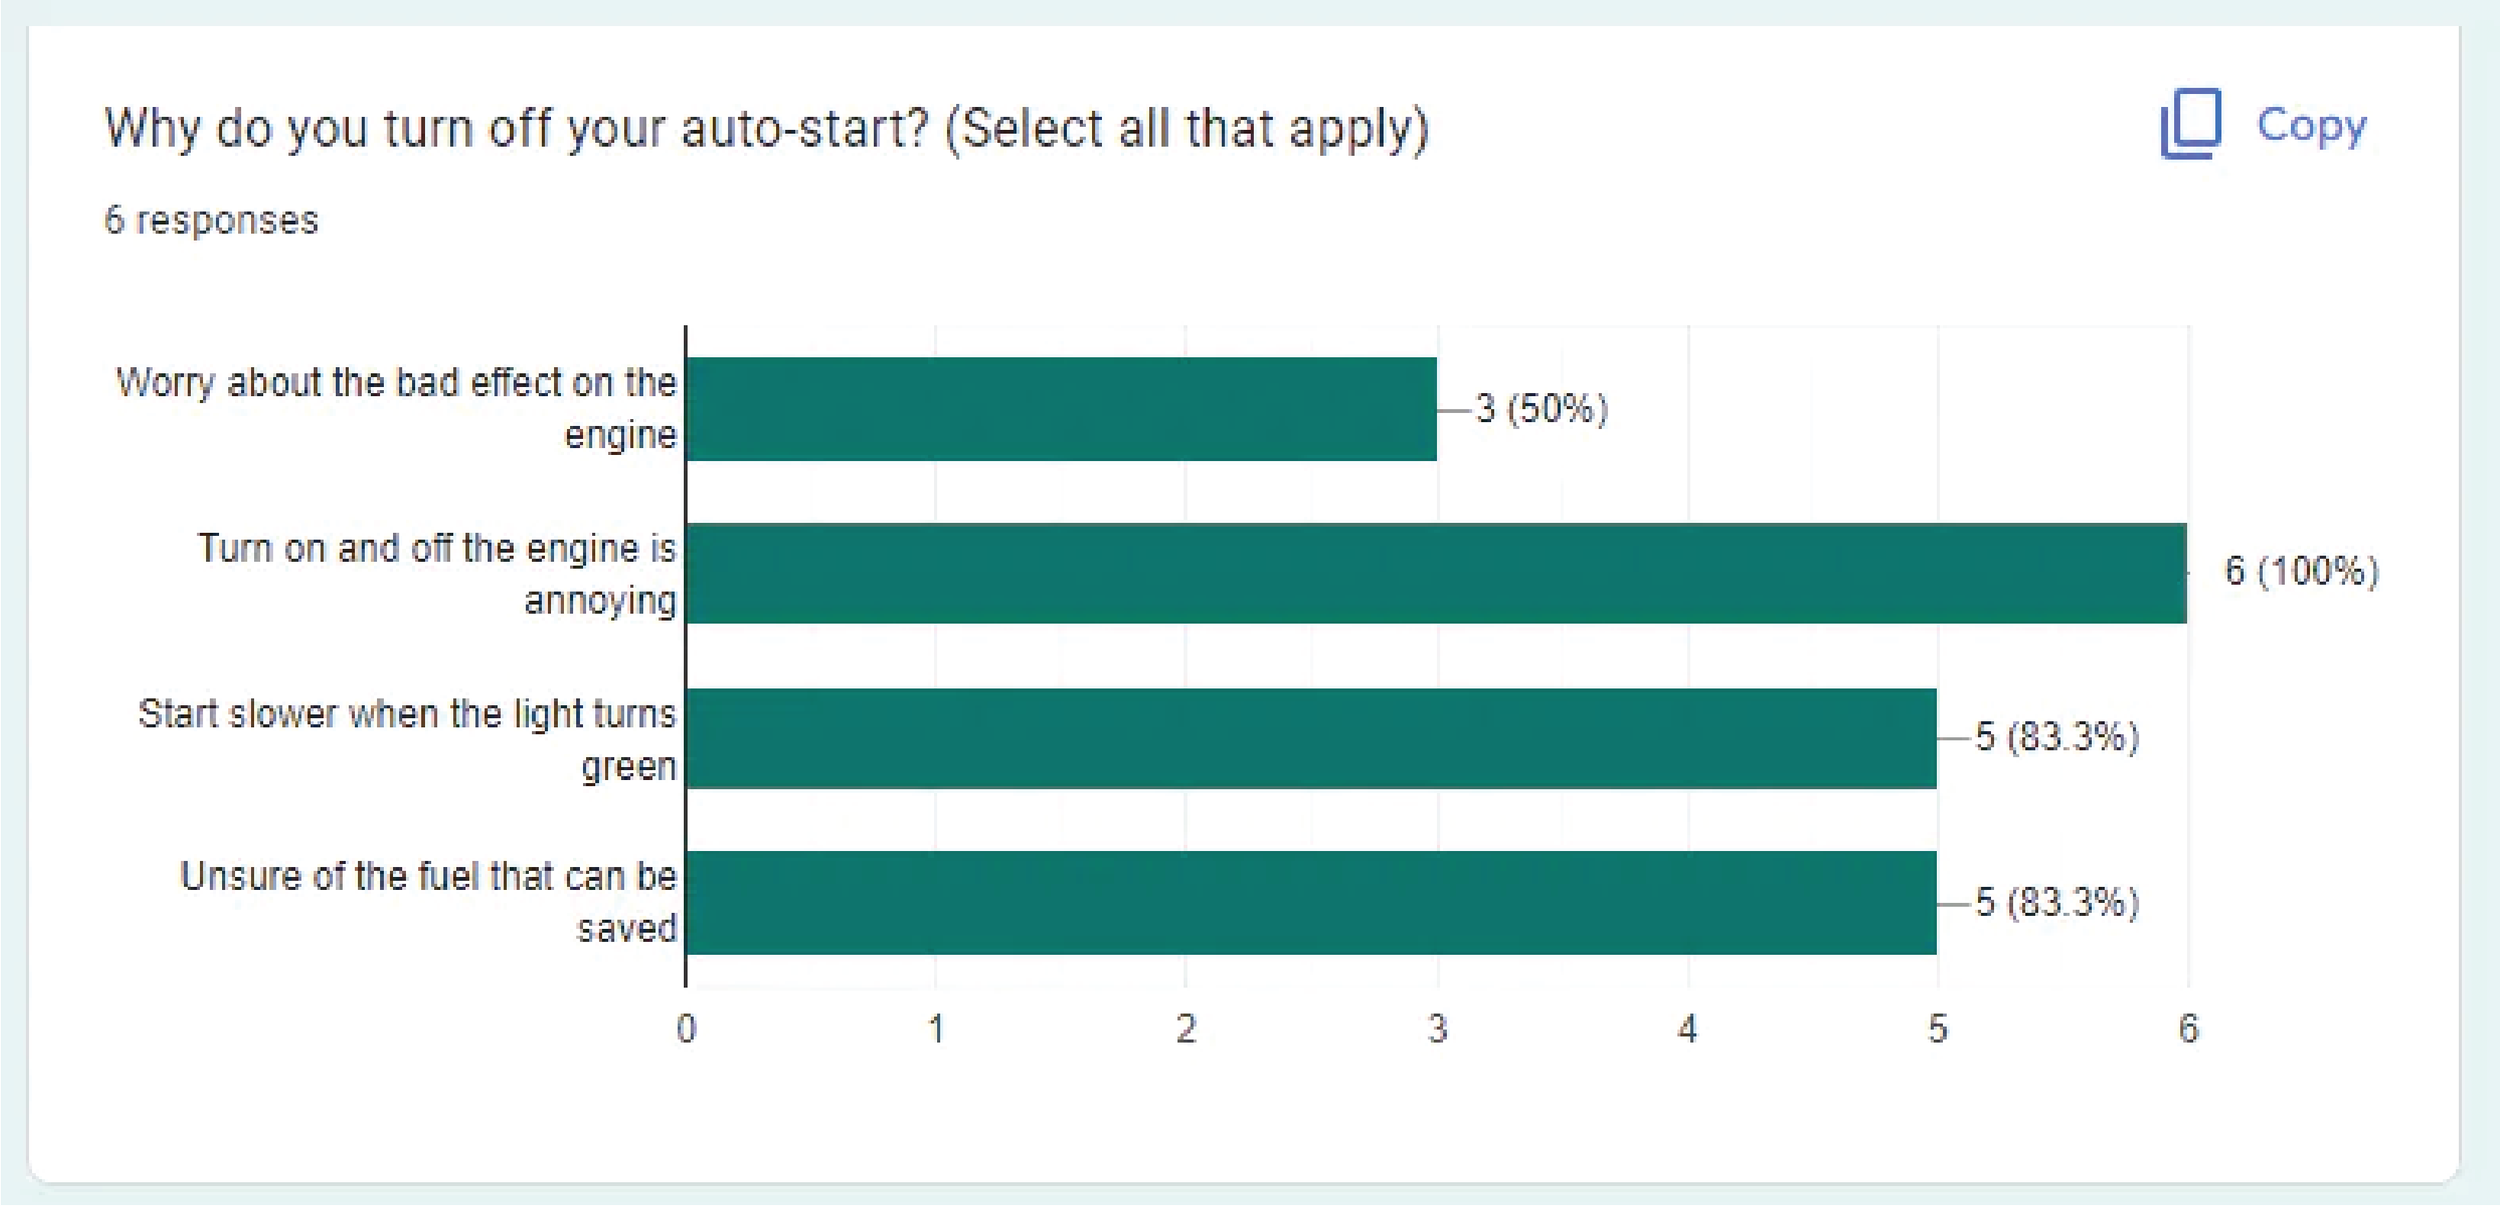
Based on the secondary research and field study, we found that most people do not turn off the engine when waiting for the traffic light. To figure out the reason behind this behavior, we decided to conduct some surveys and gather more data using Google Forms. We managed to obtain 41 responses which can be viewed on Google Sheets here.
Based on the survey results, we came up with 4 overall insights that we thought it is important for us to consider when coming up with a list of requirements for our solution at the next stage of the design process.
Auto-start function cannot fully solve the idling problem because most of cars do not have that function. Even with some cars having that function, their drivers might turn them off because they are annoying and the drivers are unsure about if that really saves gas.
Drivers will encounter more than 5 traffic lights when driving to a destination. And most of them do nothing while waiting for traffic lights.
Maps and navigation are always used while driving to a destination.
Drivers let the car idle while waiting for the traffic light mostly because they don’t know when the red light turns green.
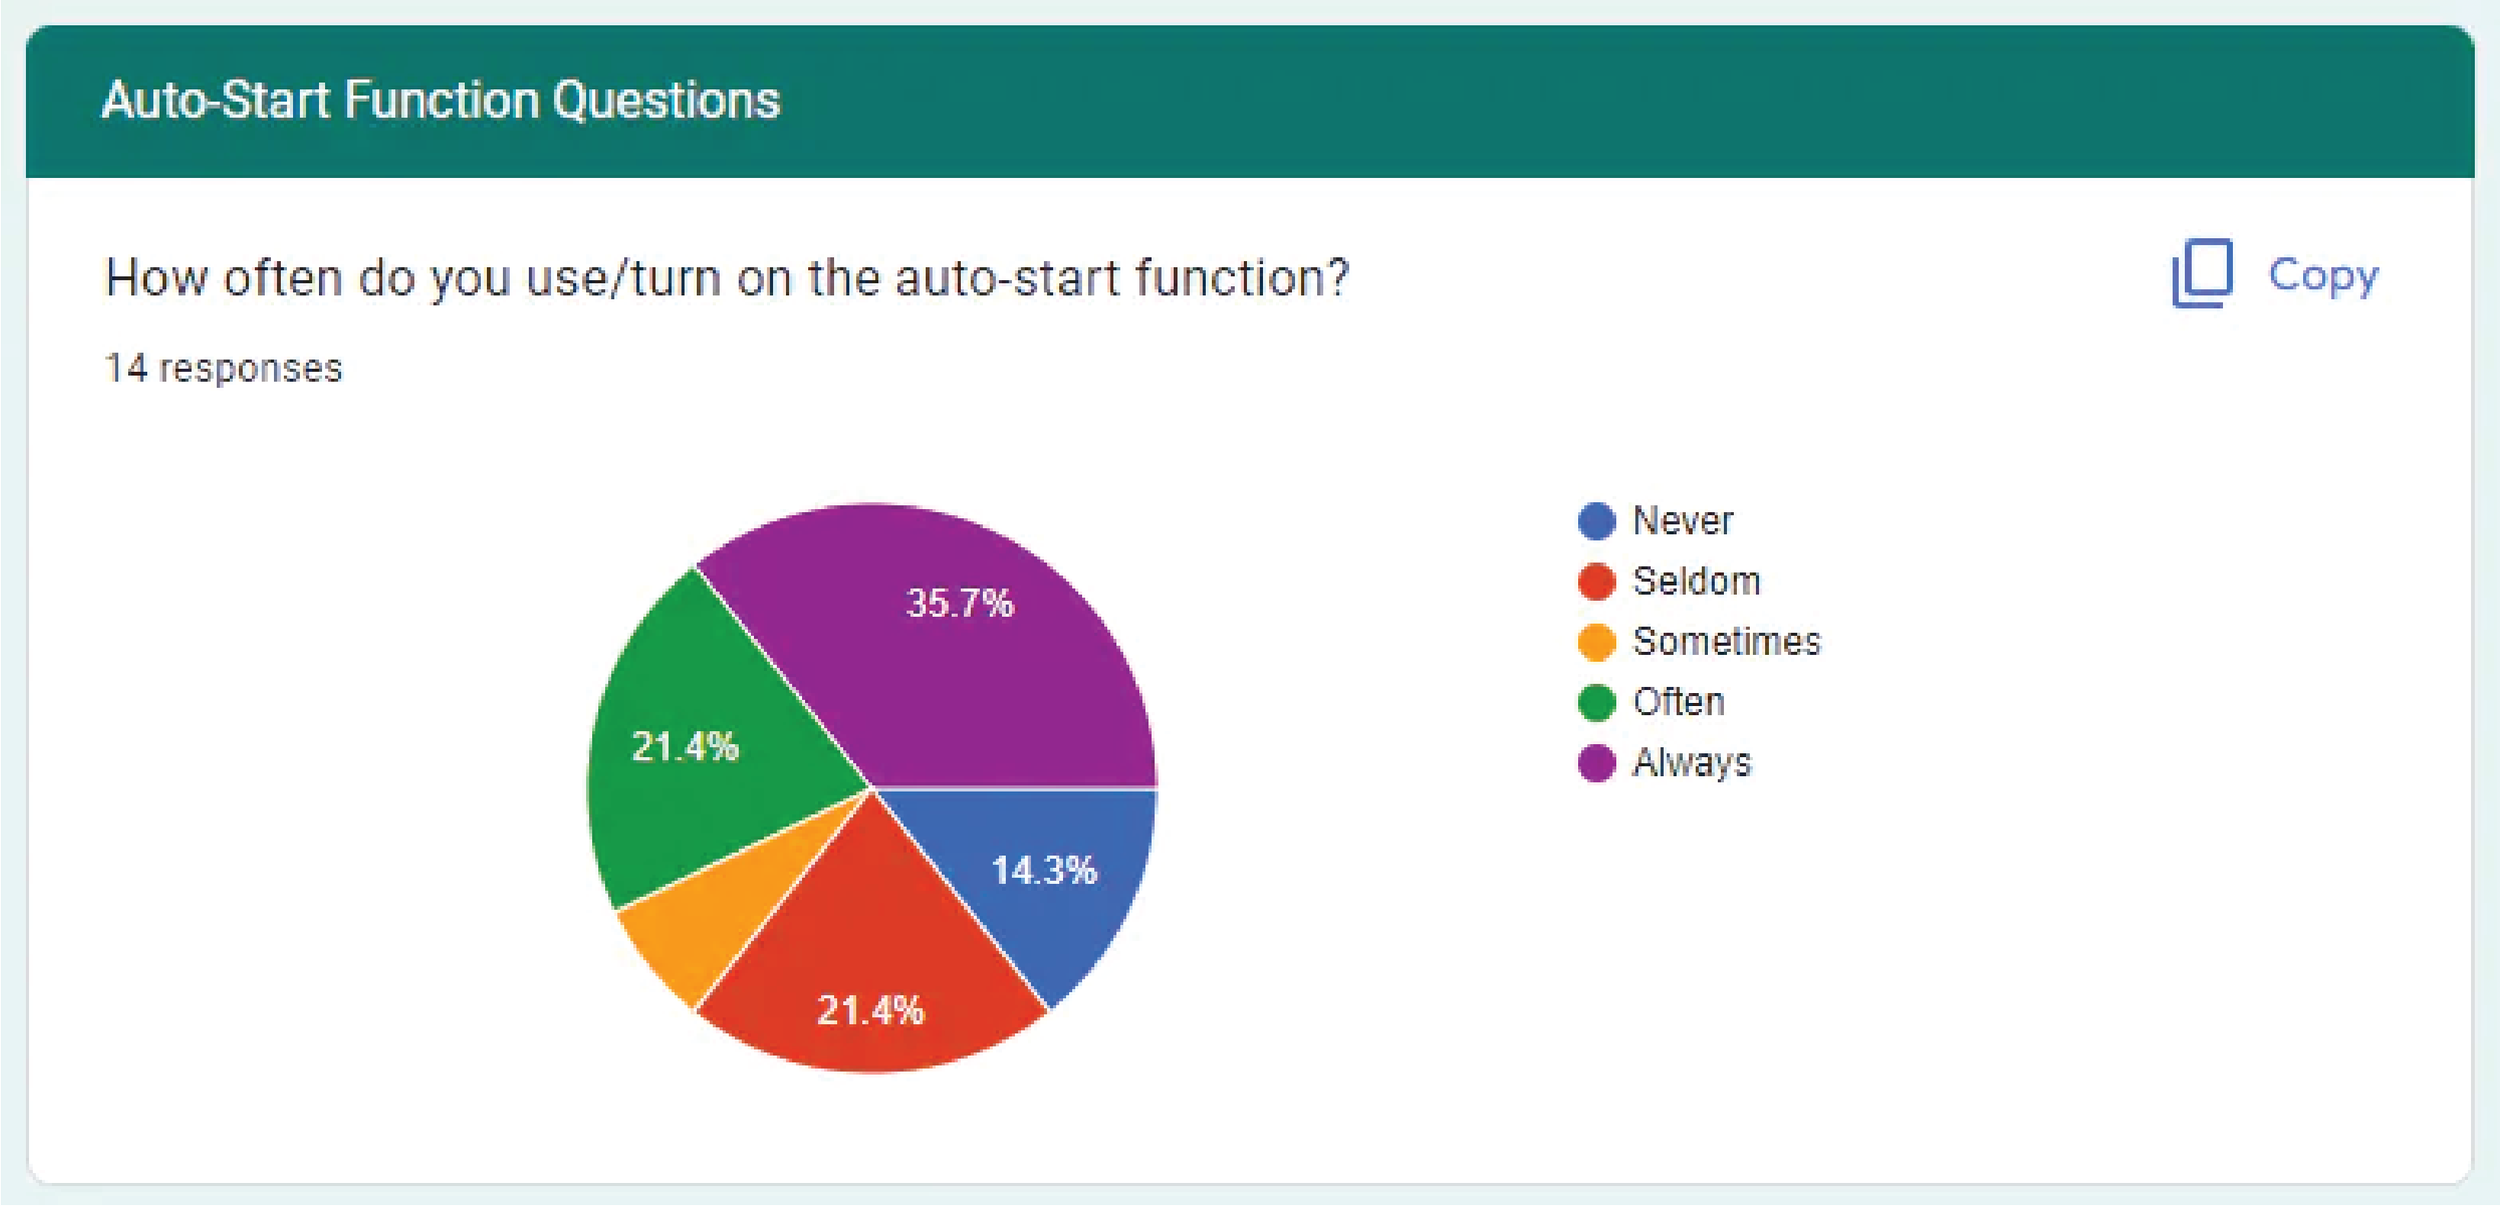
From the survey, we were able to confirm our suspicion that the built-in auto-start function does little help in reducing vehicle emissions because almost half of the participants were not using it while driving.
Reflections
In the real world, we would want to send the survey out to a larger group of people. The more people take our survey, the more accurate our data will be, so our decisions will be more effective. These survey questions helped us to understand what users truly need and want. A set of good survey questions can help us filter out unnecessary, or false assumptions.
Design
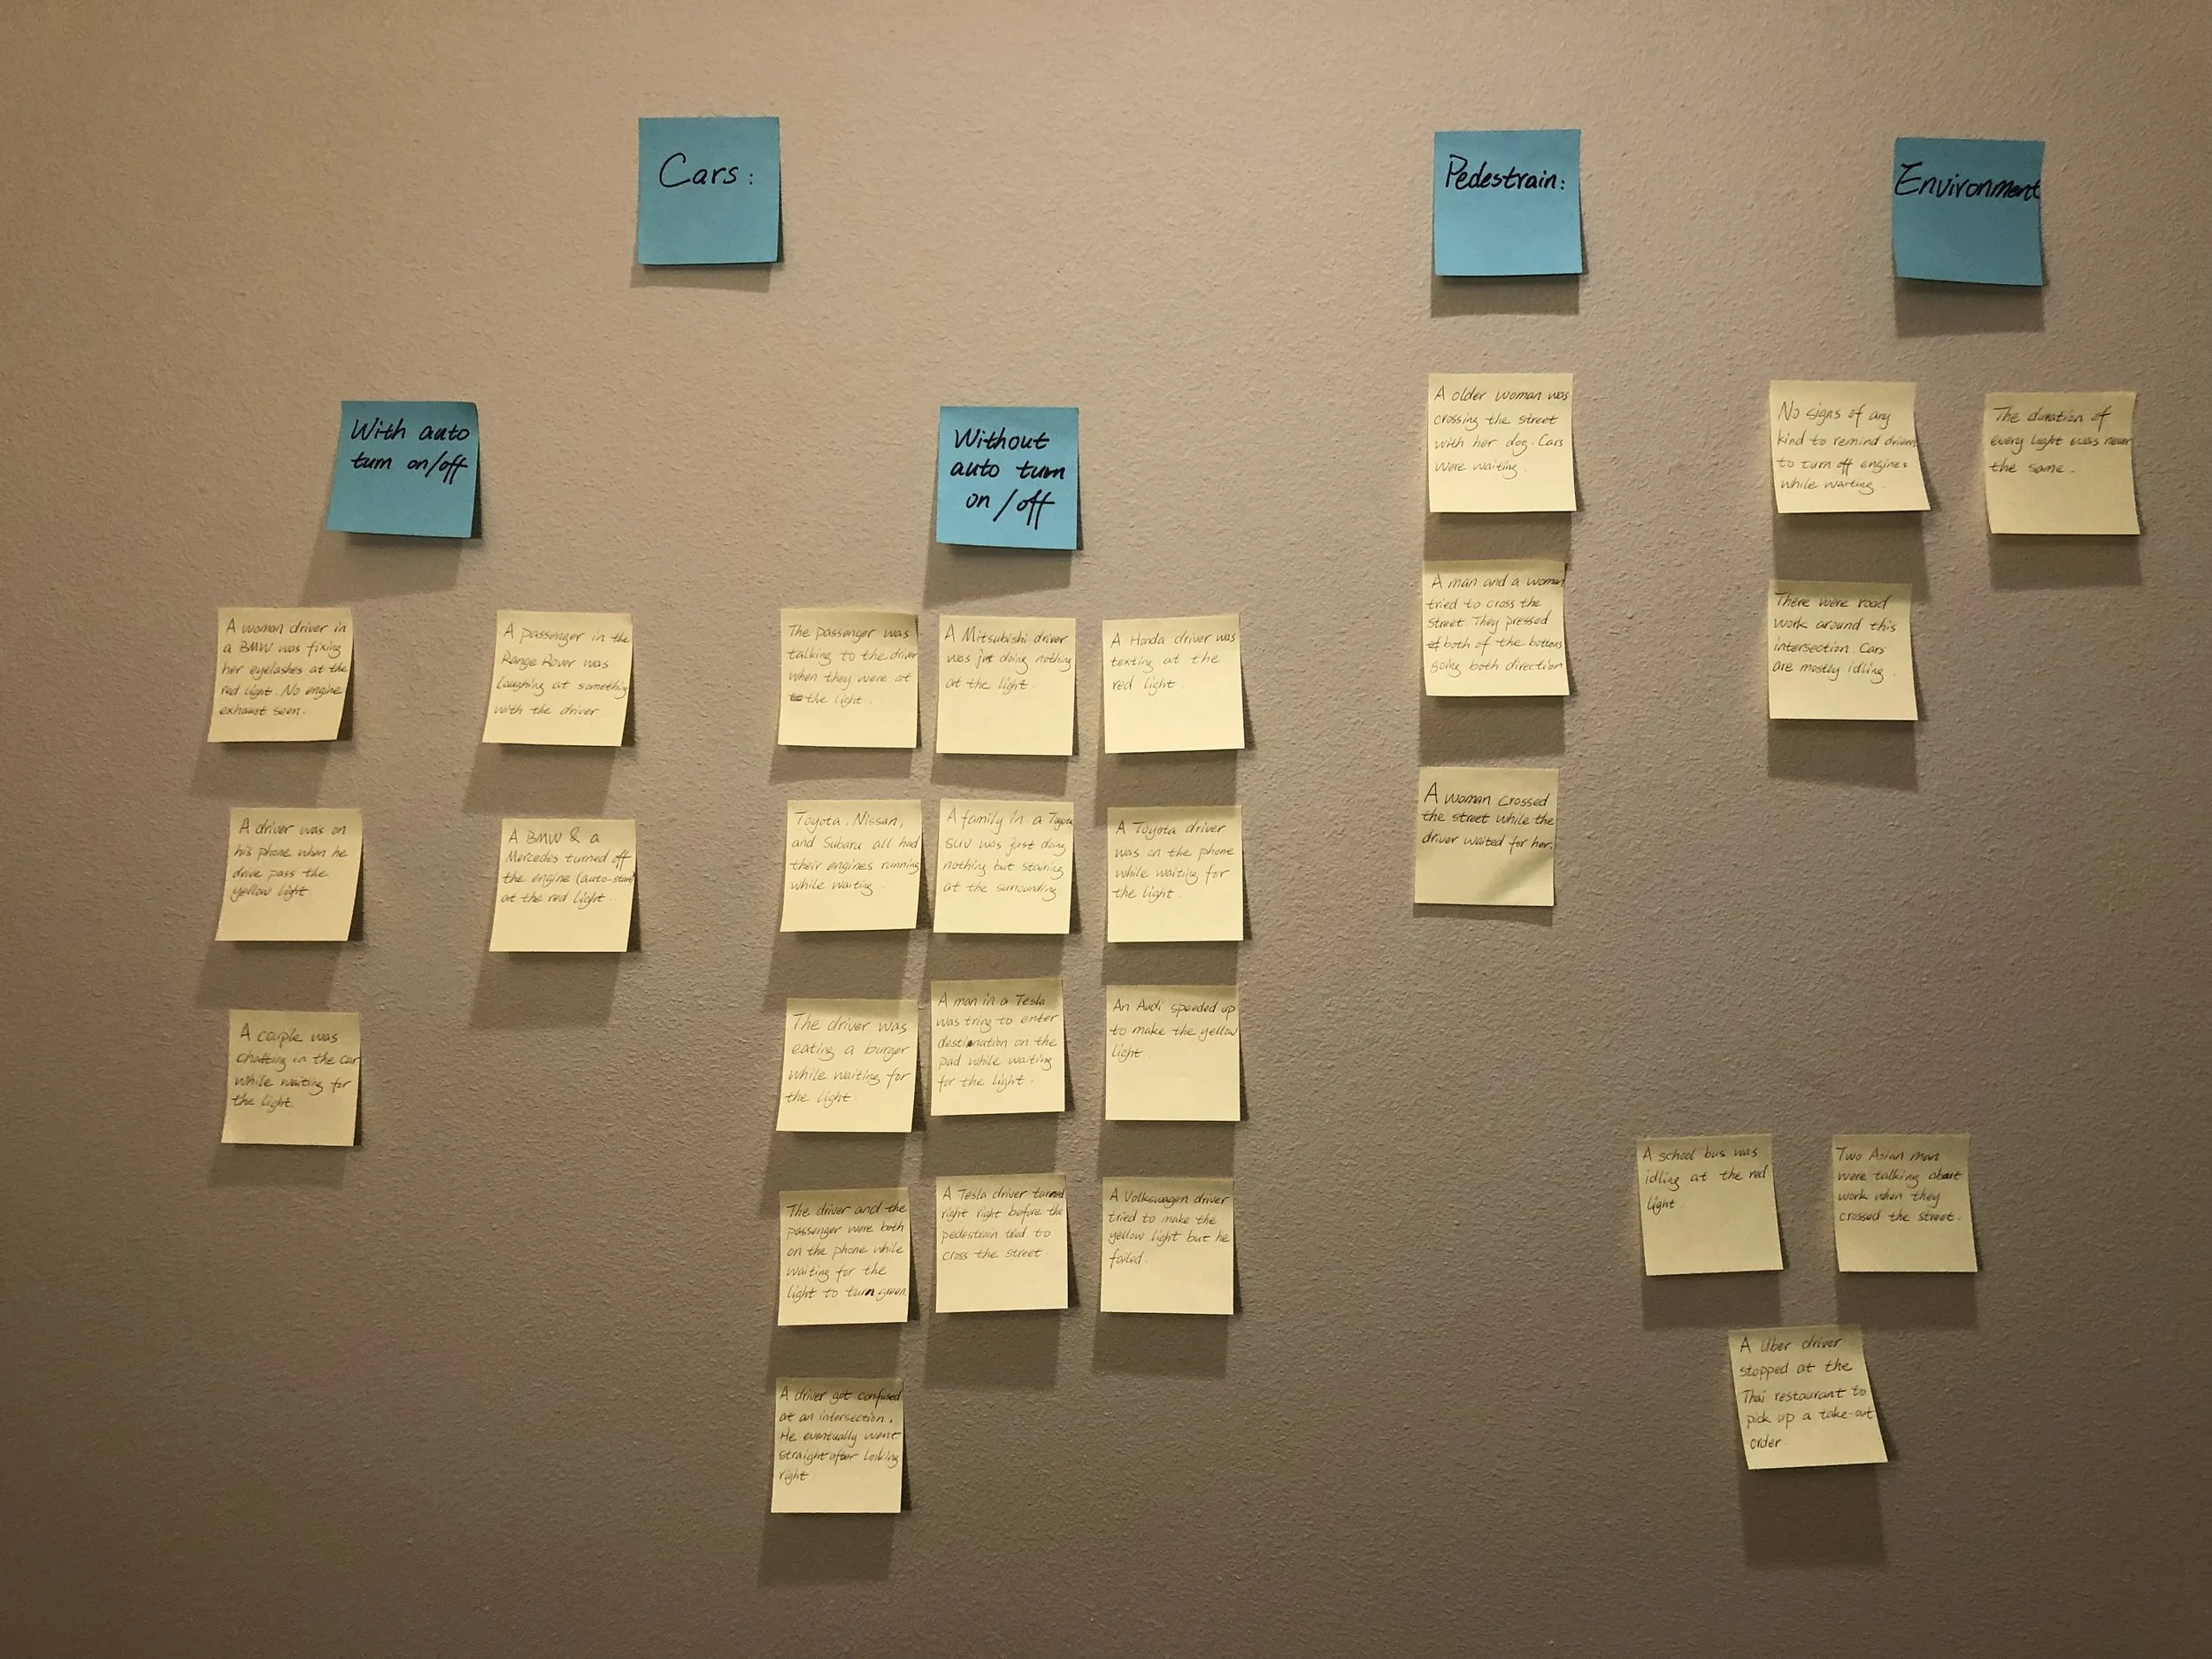
After gathering all the data obtained from the studies we have done, we began to create a list of requirements that our solution will need to have. We started by performing affinity analyses to show the relationship between each observation from our field notes.
Then we identified our stakeholders and system components that will be affected by our solution.
Main stakeholder
All the drivers in King county. We aim to design a smart system that provides live information on incoming traffic, and safe but efficient ways to avoid idling time specifically when waiting for traffic lights.
Secondary stakeholders
City Planning Department and Environmental Protection Department. We believe that the data generated by the system we aim to design can help the city plan routes and traffic lights even better.
Other stakeholders
Car manufacturers can see why drivers choose to turn off the auto-start function in their cars so that they can improve the mechanism.
Design Goals
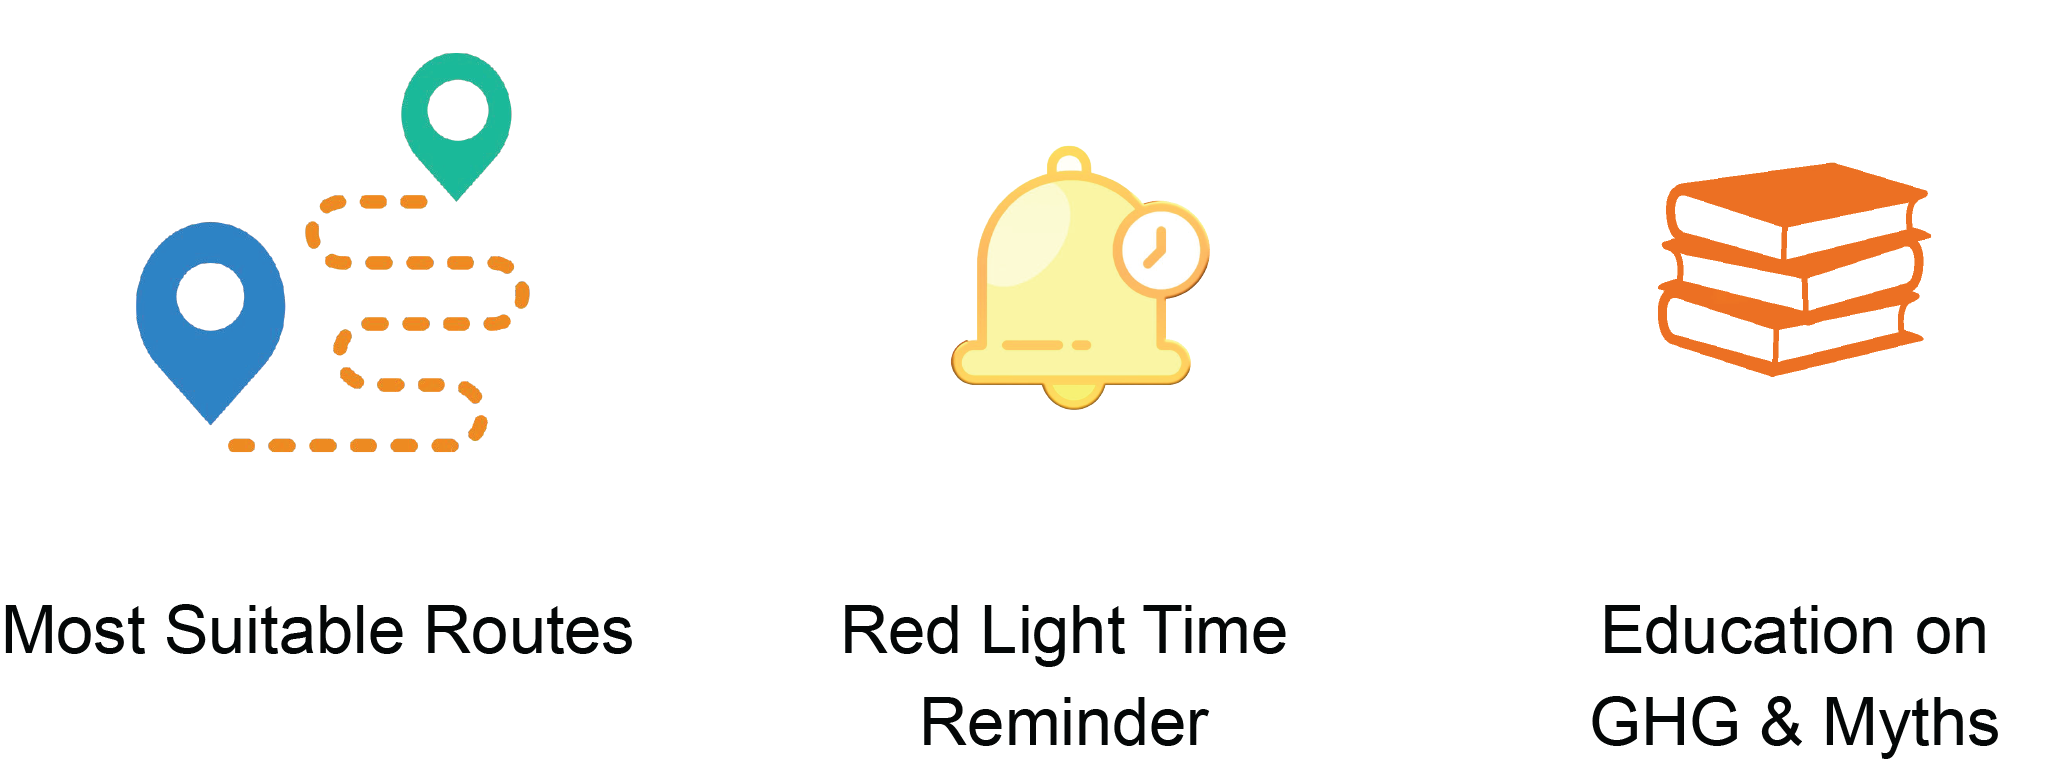
At this point, we created the 3 design goals that we wanted to solve with our app.
Most Suitable Routes: We wanted to provide users with suitable routes that can both save time and reduce vehicle emissions.
Red Light Time Reminder: We wanted to provide a countdown for the red light so that users can decide whether turning off their car engines is worth it or not.
Education on Greenhouse Gas Emissions and Myths: We wanted to provide a place for users to obtain accurate information about the auto-start function in their cars.
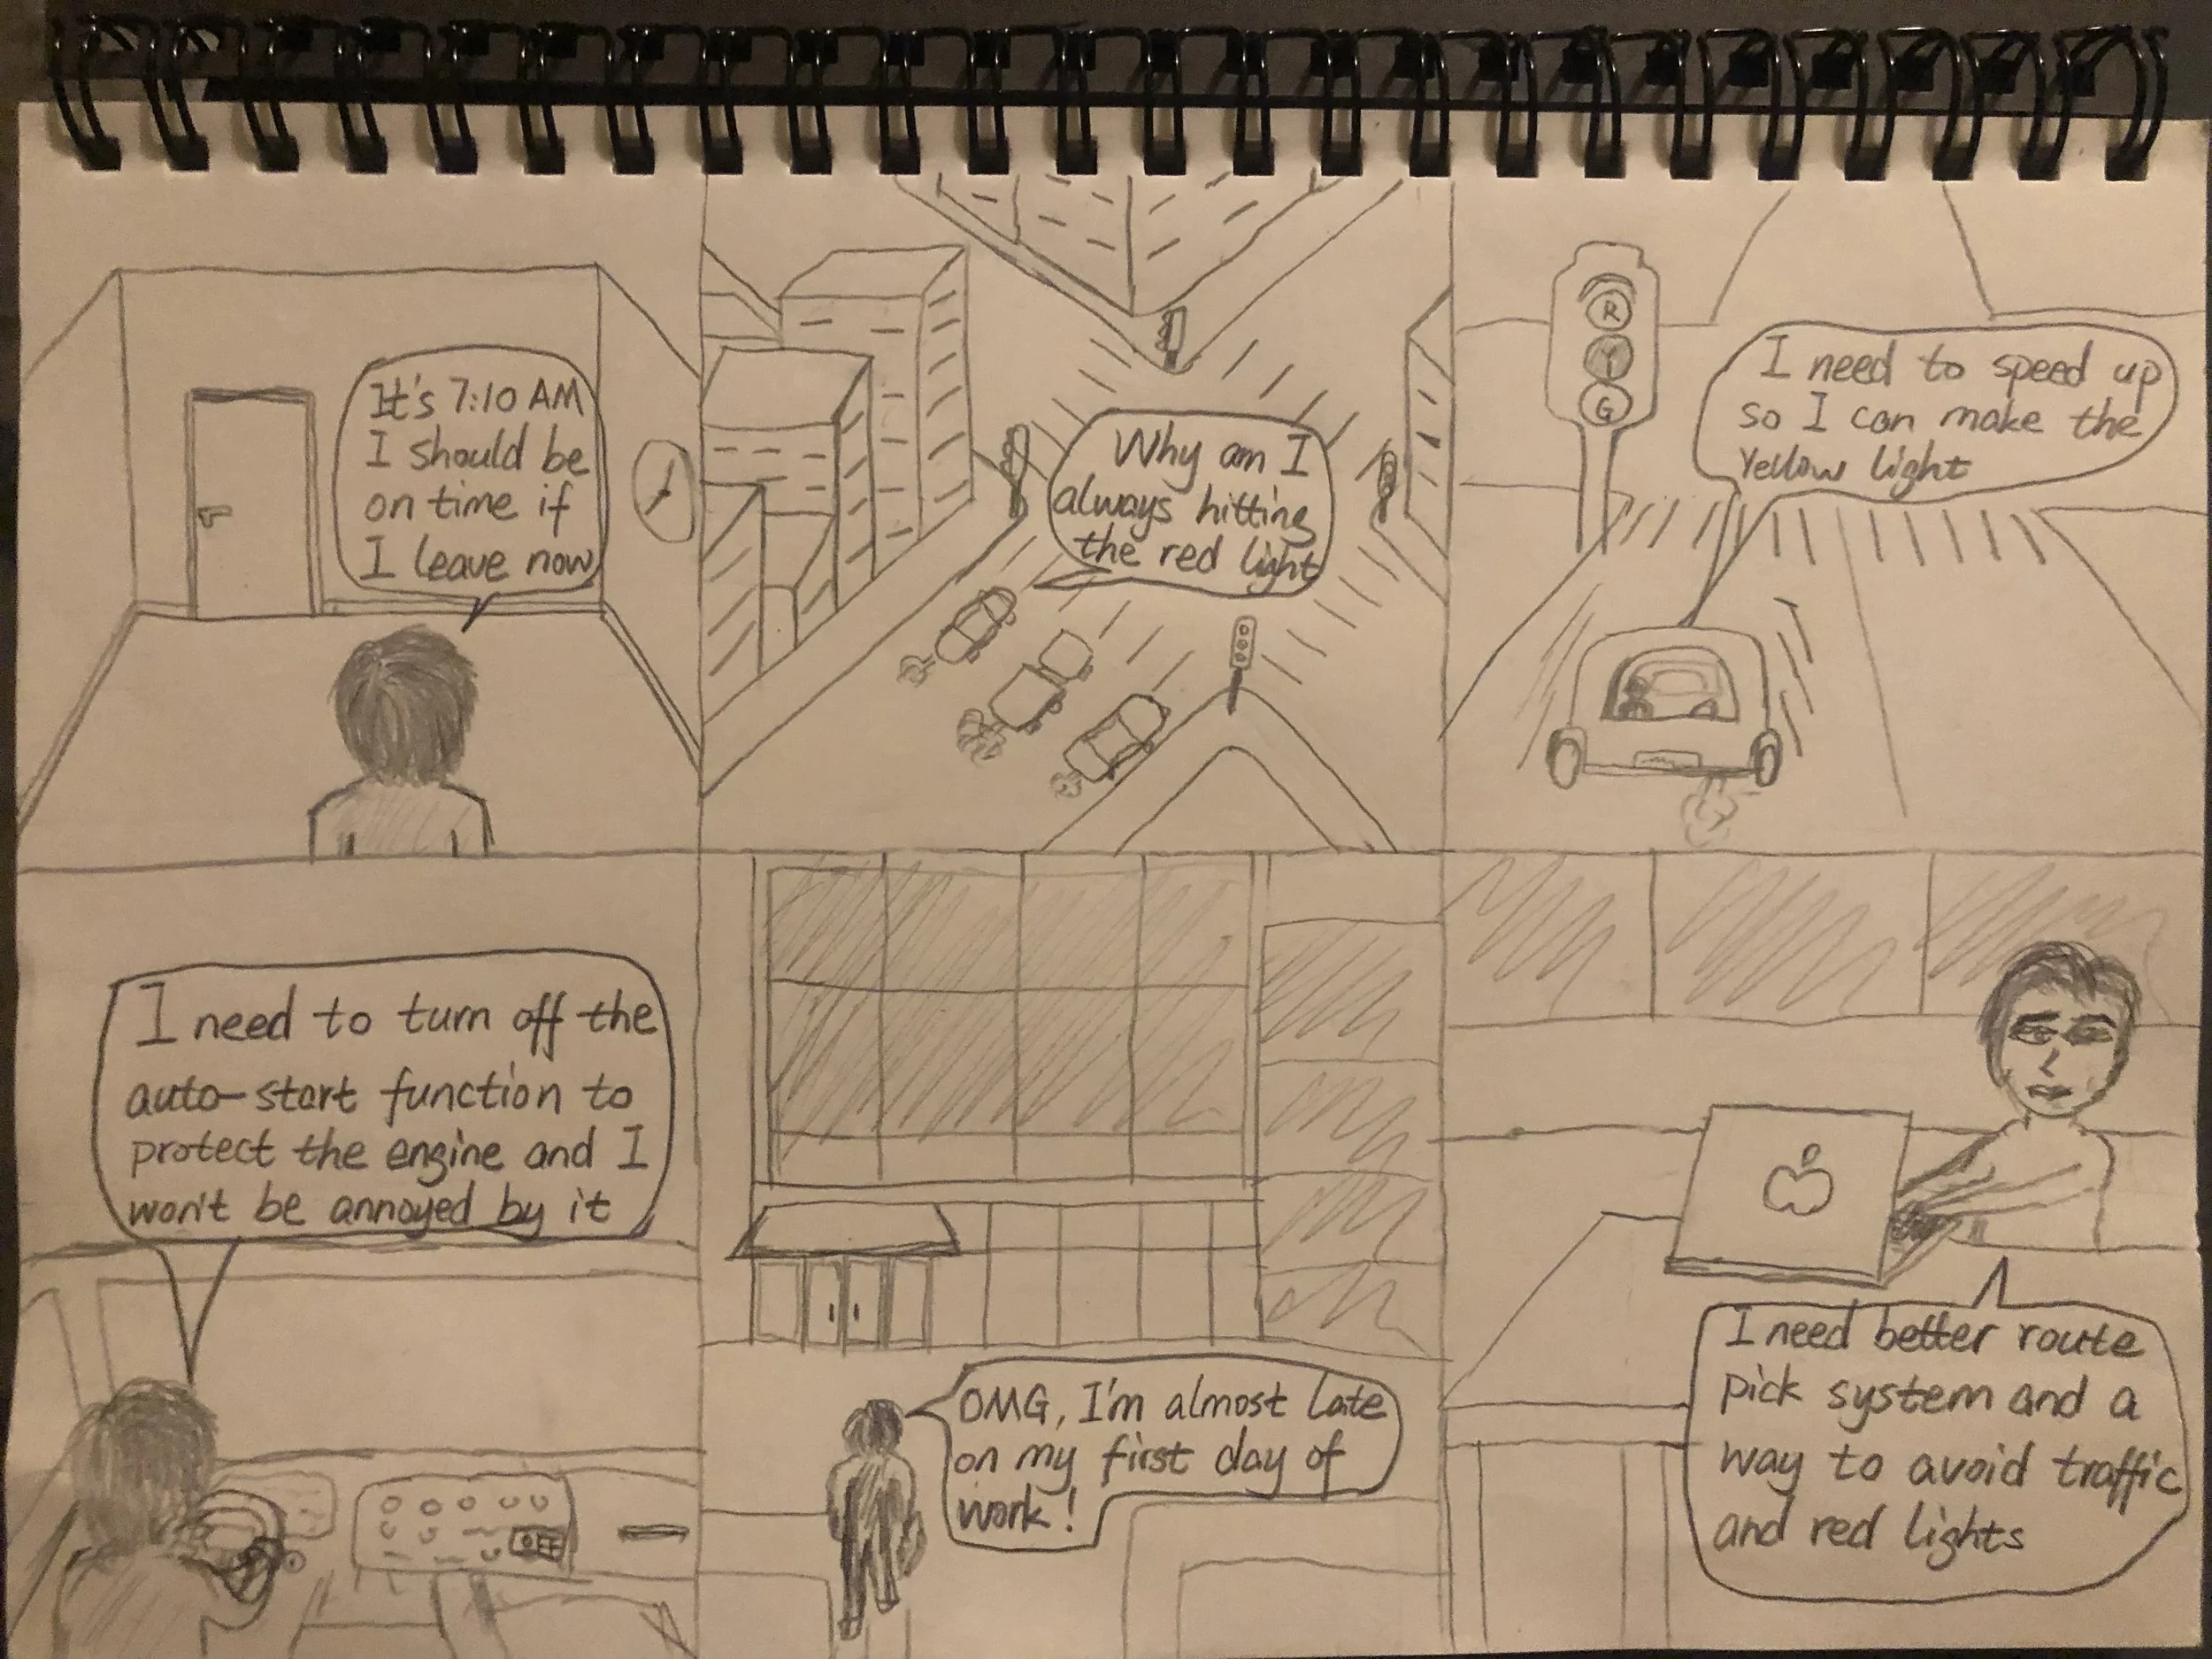
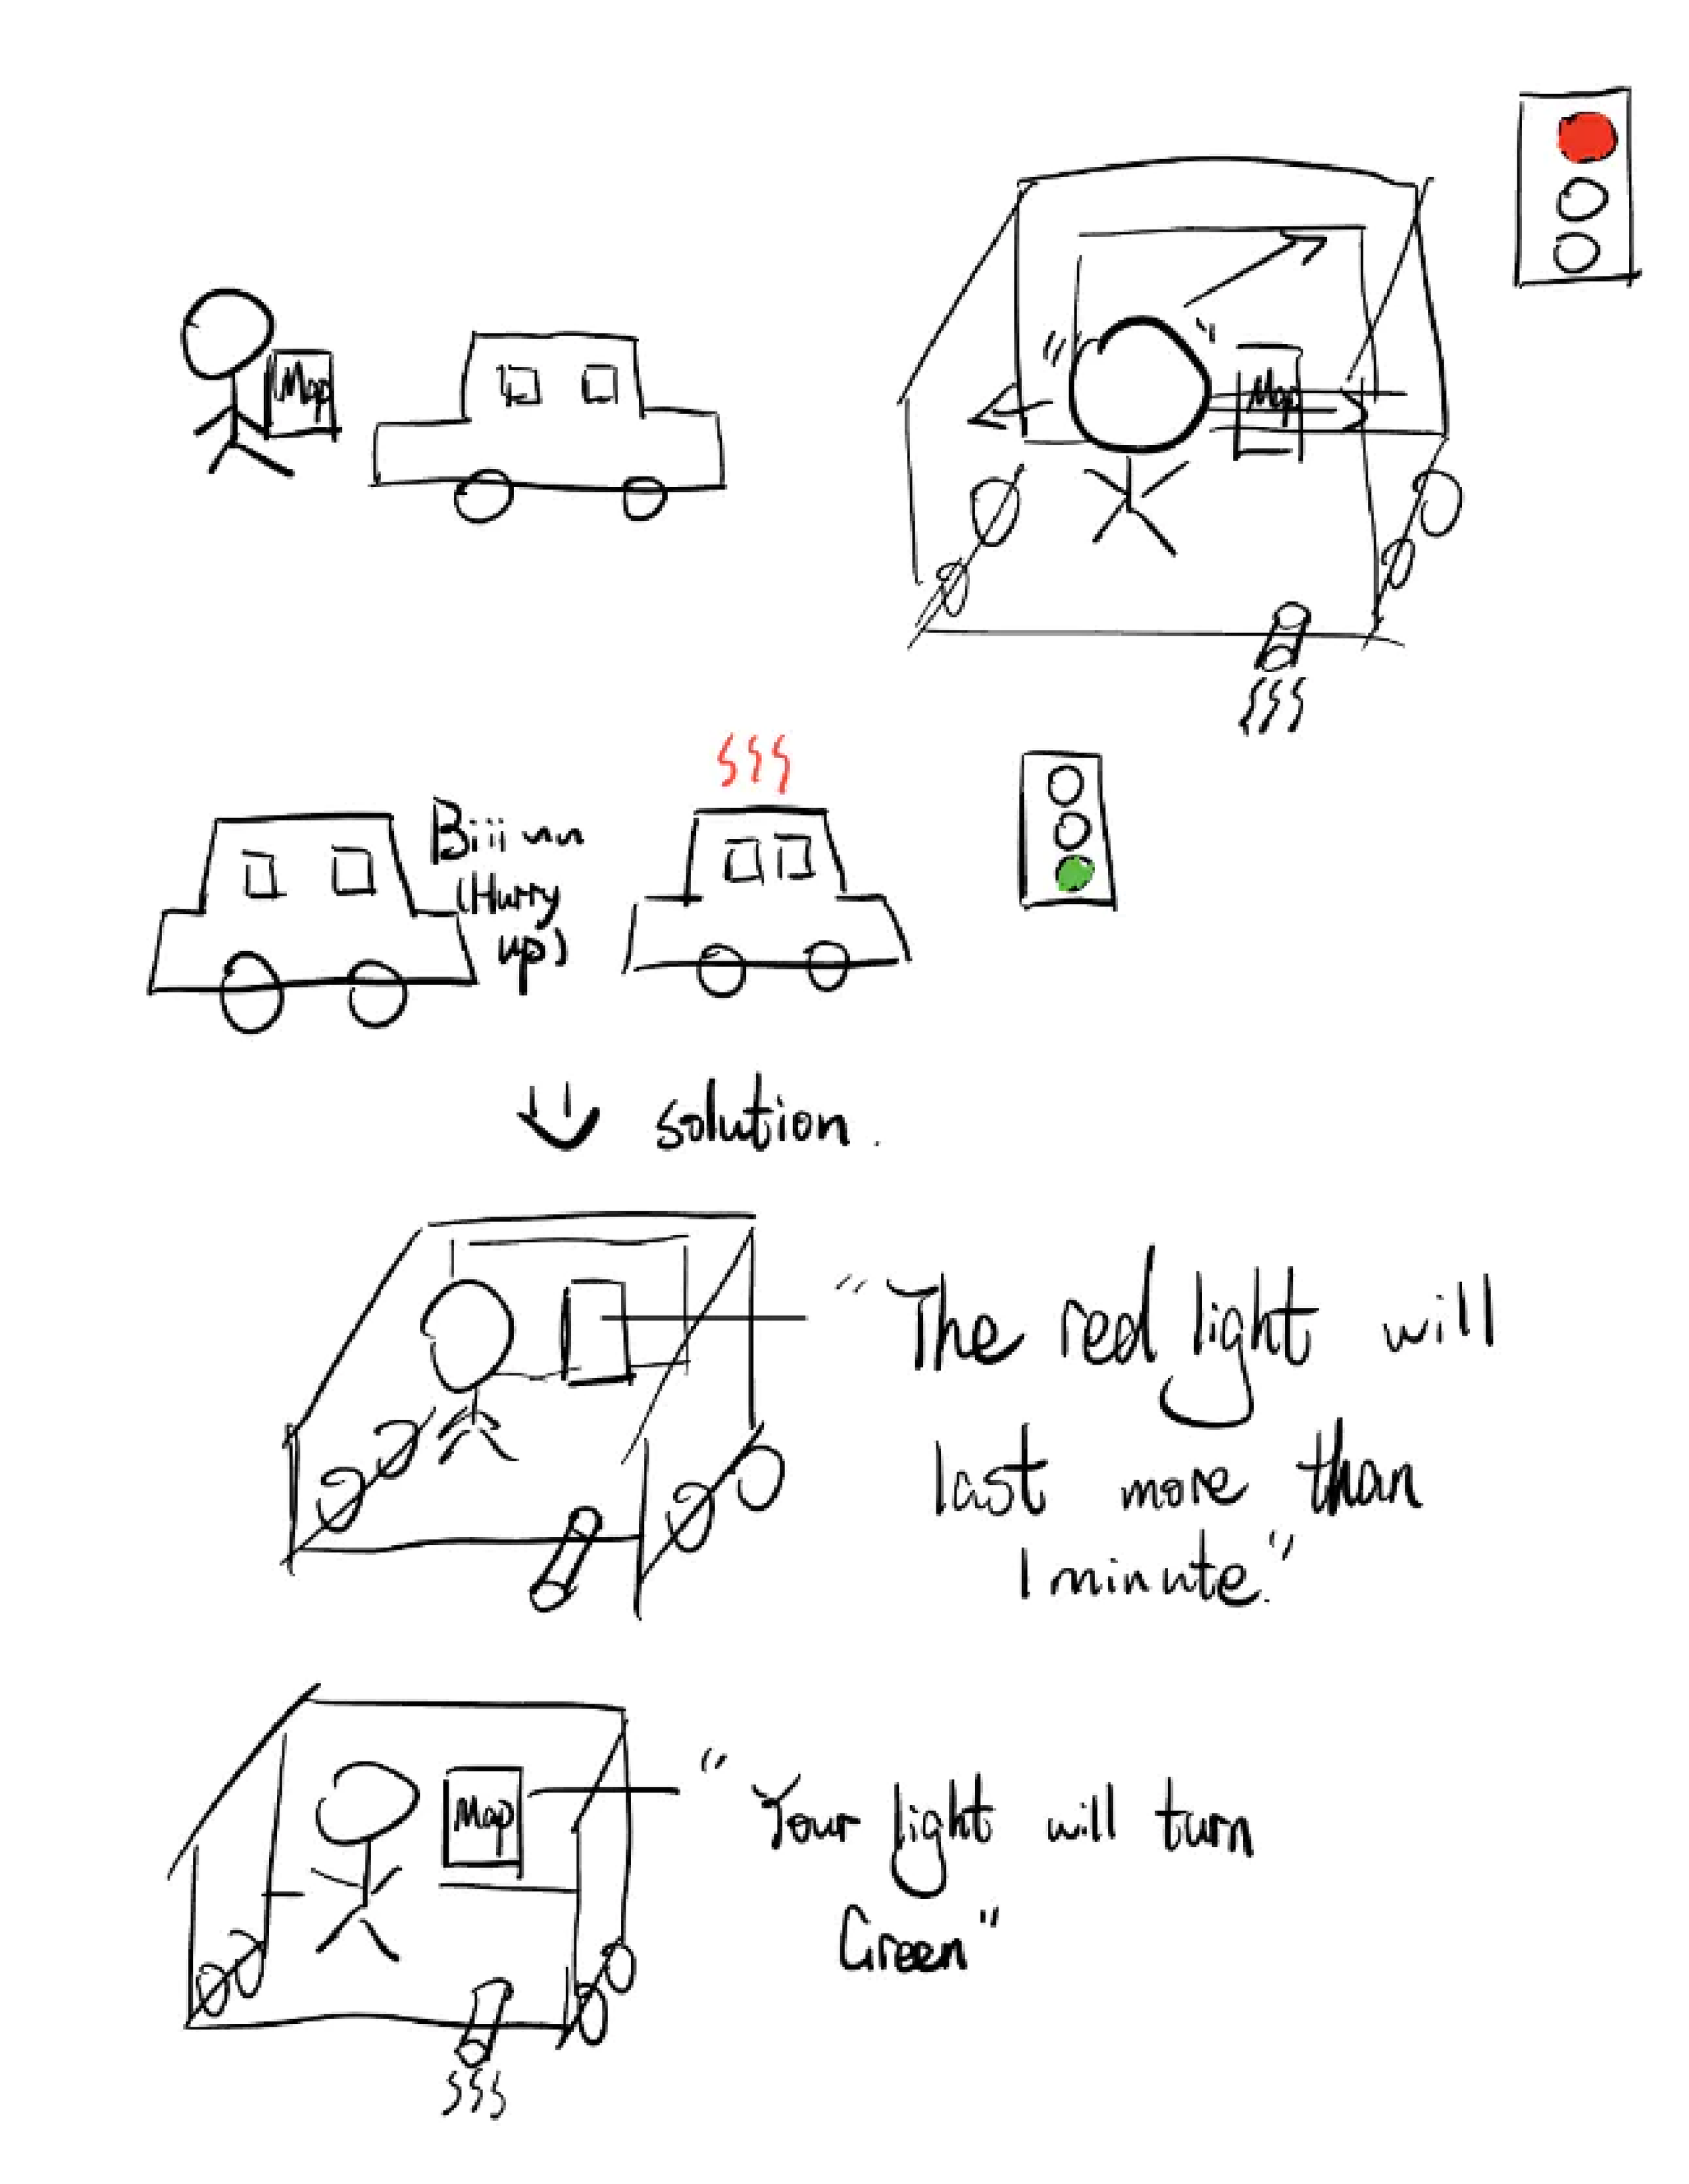
With these design goals in mind, we then proceed to create a couple of sketches that helped us to identify the core tasks that we wanted to prototype and test.
Storyboards
With these design goals in mind, we then proceed to create some sketches that helped us to identify the core tasks that we wanted to prototype and test.
Most Suitable Routes: We wanted to provide users with suitable routes that can both save time and reduce vehicle emissions.
Red Light Time Reminder: We wanted to provide a countdown for the red light so that users can decide whether turning off their car engines is worth it or not.
Education on Greenhouse Gas Emissions and Myths: We wanted to provide a place for users to obtain accurate information about the auto-start function in their cars.
With these design goals in mind, we then proceed to create a couple of sketches that helped us to identify the core tasks that we wanted to prototype and test.
Reflections
When we are coming up with the requirements, we were glad that we had plenty of data to work on and that every goal we came up with can be supported by our research.
All those research helped us quickly generate our requirements. The sketches we drew also helped us to visualize what kind of features are beneficial to our users. Providing that we only have a week to create our prototype, the sketches helped us to identify the core features that we wanted to implement and test during the usability tests.
Everyone can sketch, and everyone should sketch. Coming from an architecture background, I was surprised how sketching can help the design thinking pross so much.
Initial Prototype
Usability Testing
From our scenario sketches, we came up with 6 core tasks that we wanted to demonstrate during our usability testing.
Generate routes with customized filters from one place to another.
Notify users of the remaining time of the red light.
Provide more information about upcoming traffic.
Calculate how much gas will users be saving and how much greenhouse gas emissions are reduced after reducing idling time.
Educate users about the auto-start function and whether it would hurt the engine or not.
Motivate users to turn off the engine.
Having those core tasks in mind, we created our basic app UI using Figma. For the usability testing, we wanted to understand how easy it is for users to understand the functionalities and UI elements in the app. By creating an app that is both effective and easy to use, we hope to bring more users to use the app so that we can reduce greenhouse gas emissions more effectively.
The test's purpose is to evaluate the user interface design of the app. We hope to gain an understanding of user expectations, difficulties, and recommendations as to how to improve the application for future iterations.
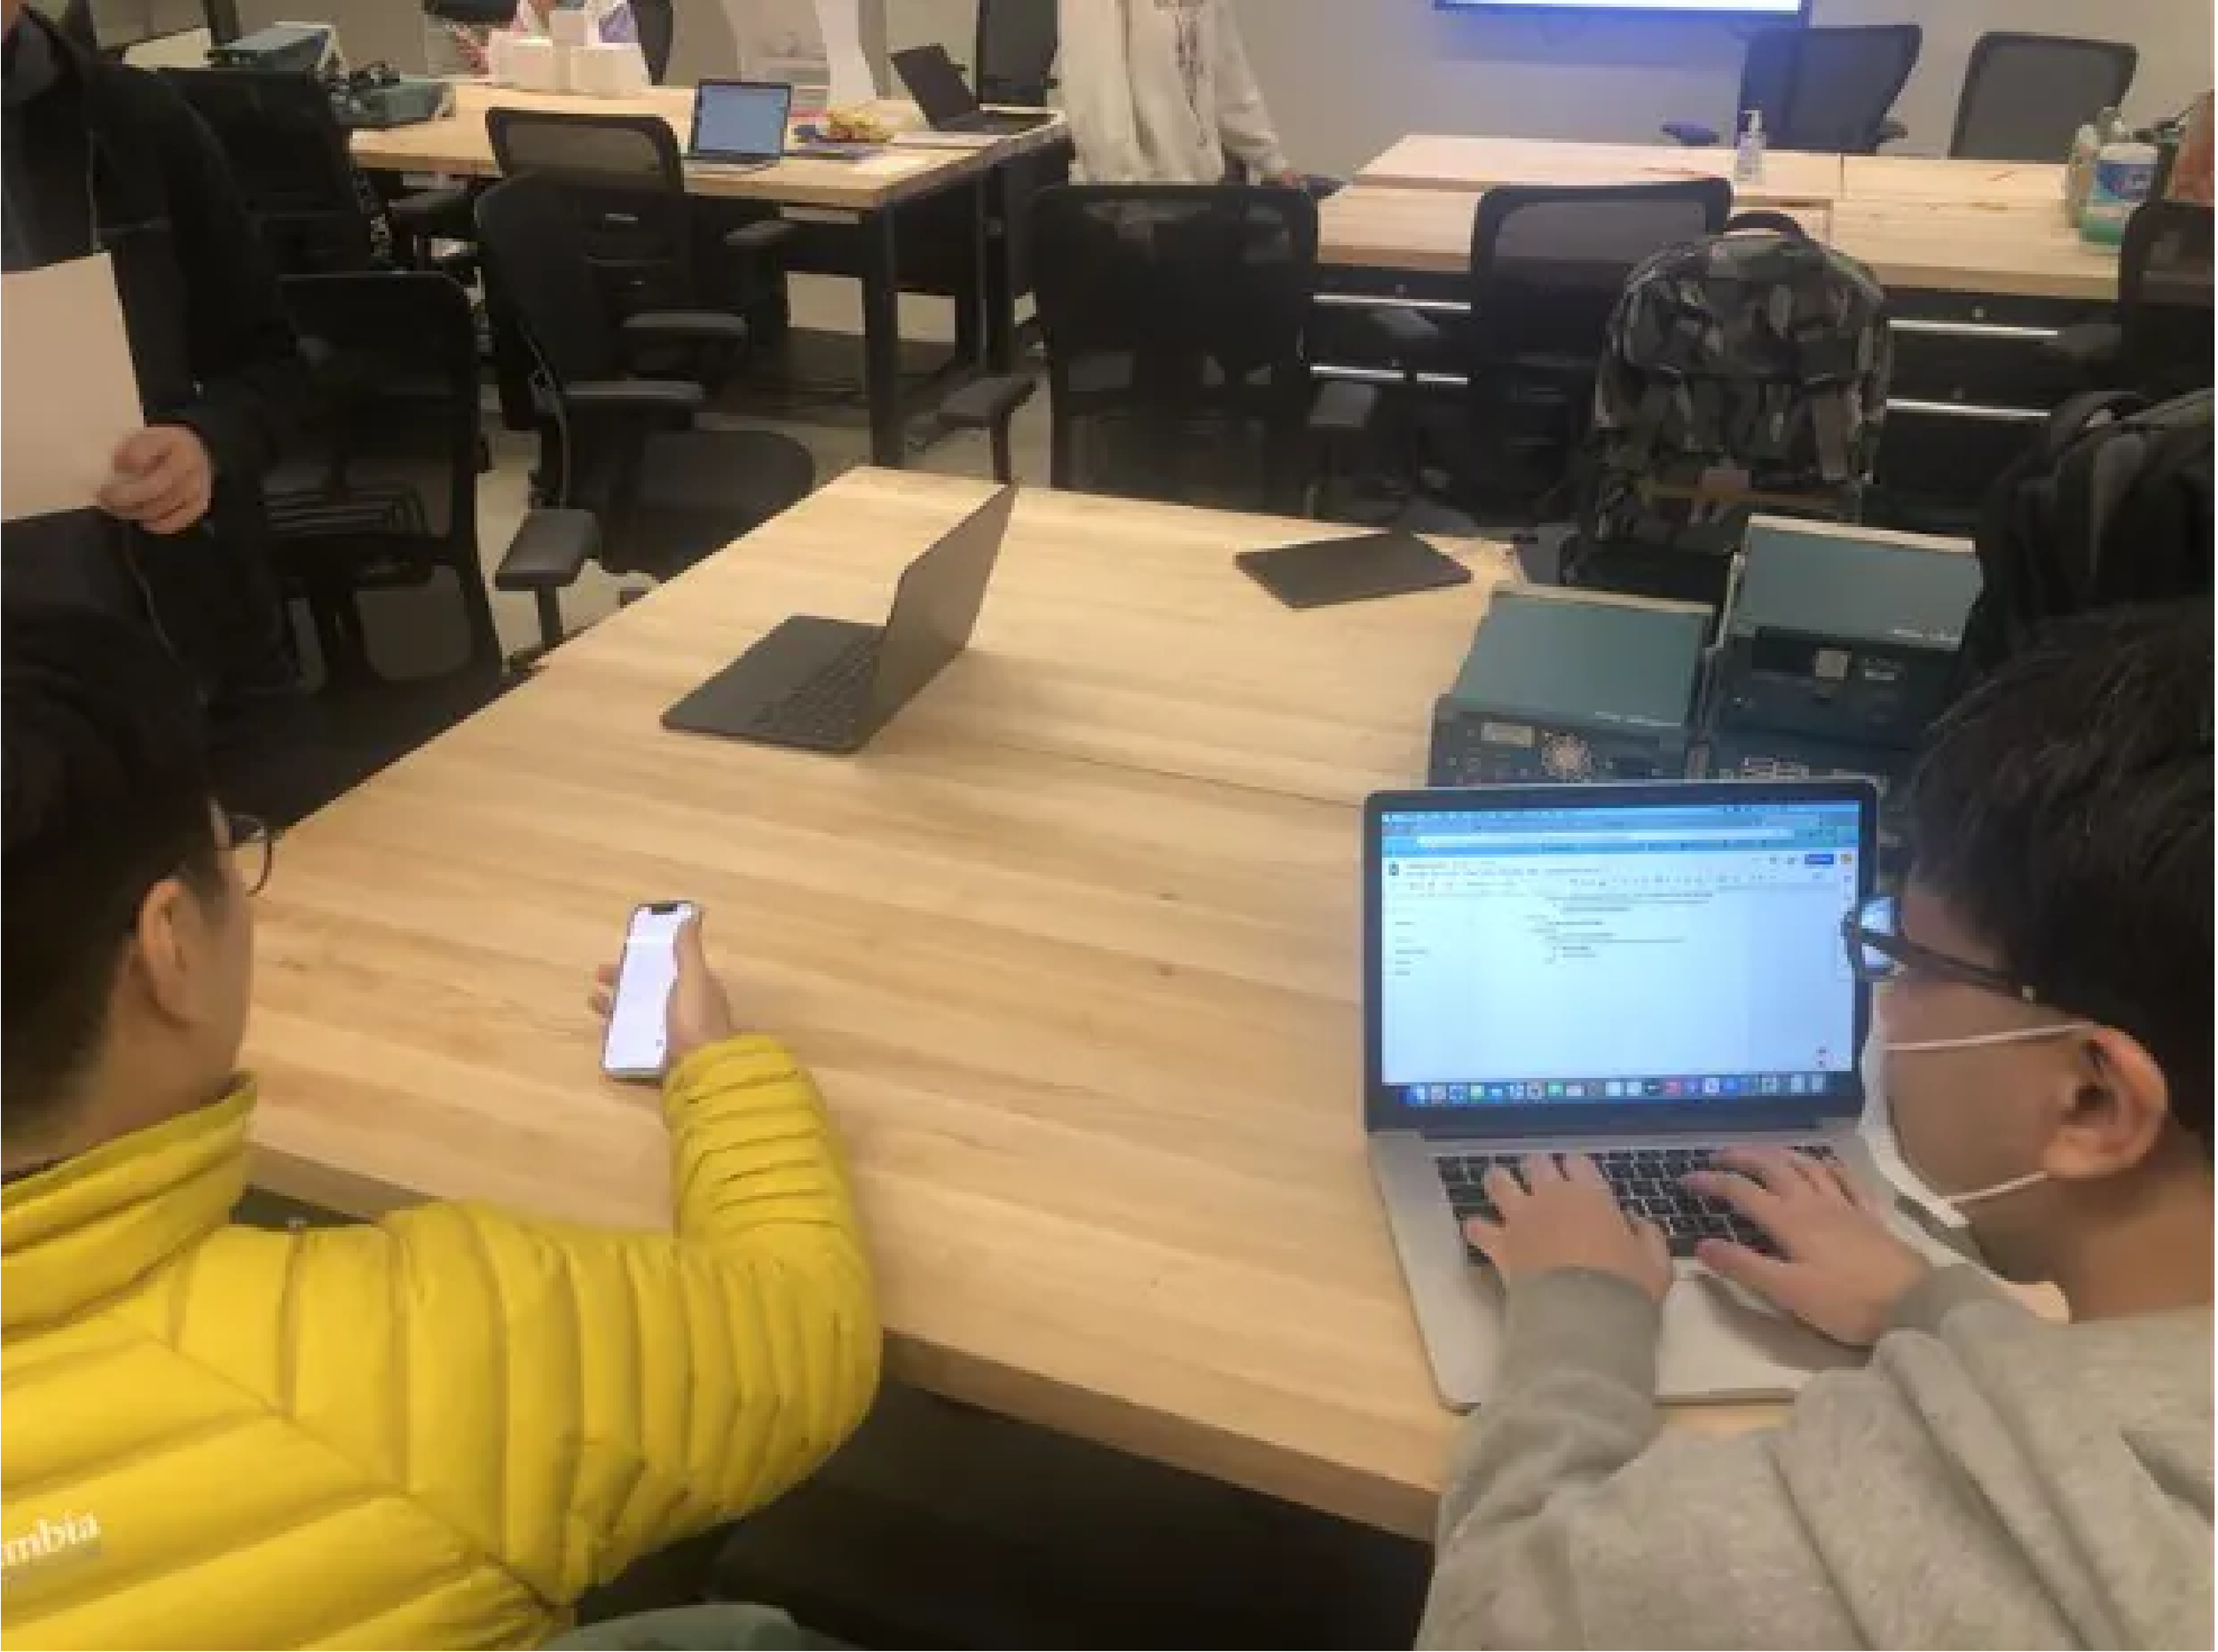
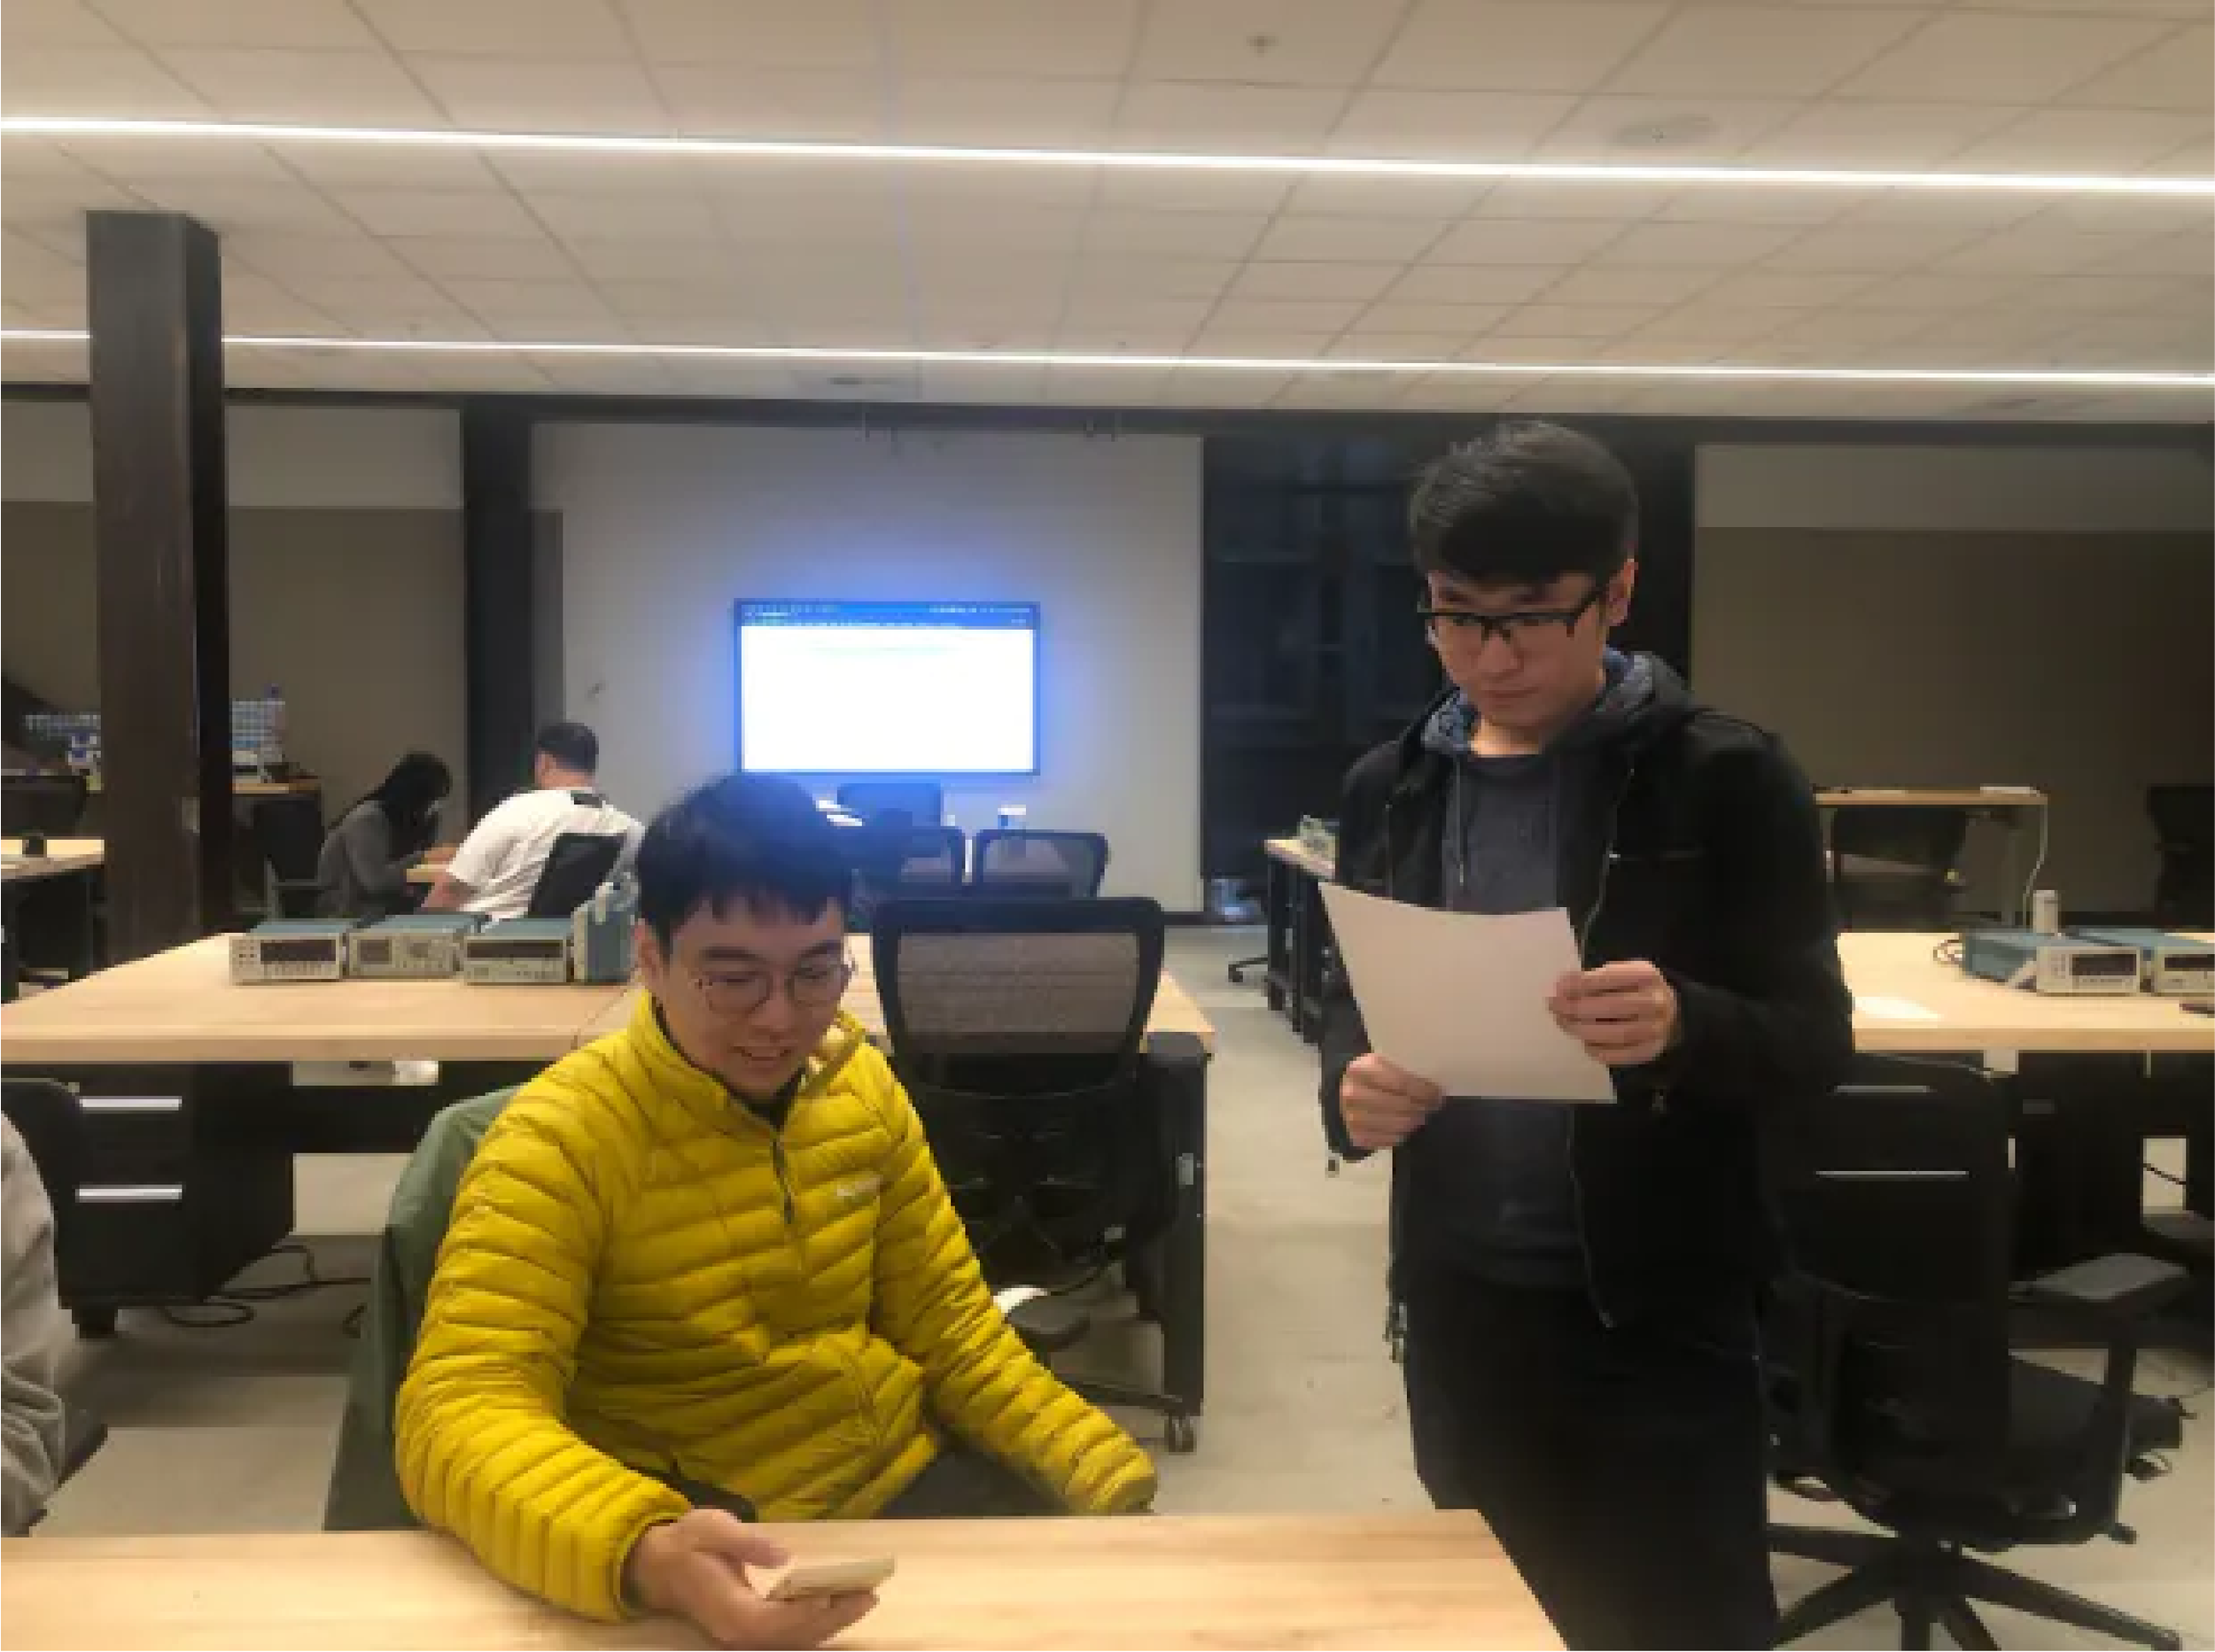
Our main method of testing is simply observing the participants and taking notes along the way. By letting participants try the app without our interference, we would have a clear idea of whether the flow and UI design of the app is straightforward for first-time users.
After participants finished navigating through the app. We then asked them several additional questions that we were not able to answer by observing. We went through the app again from start to finish pages and asked them about the flow and how they feel about the UI design. Finally, we end our testing session by asking them about the idea and any additional features they might want so that they are more willing to use the app in their daily lives.
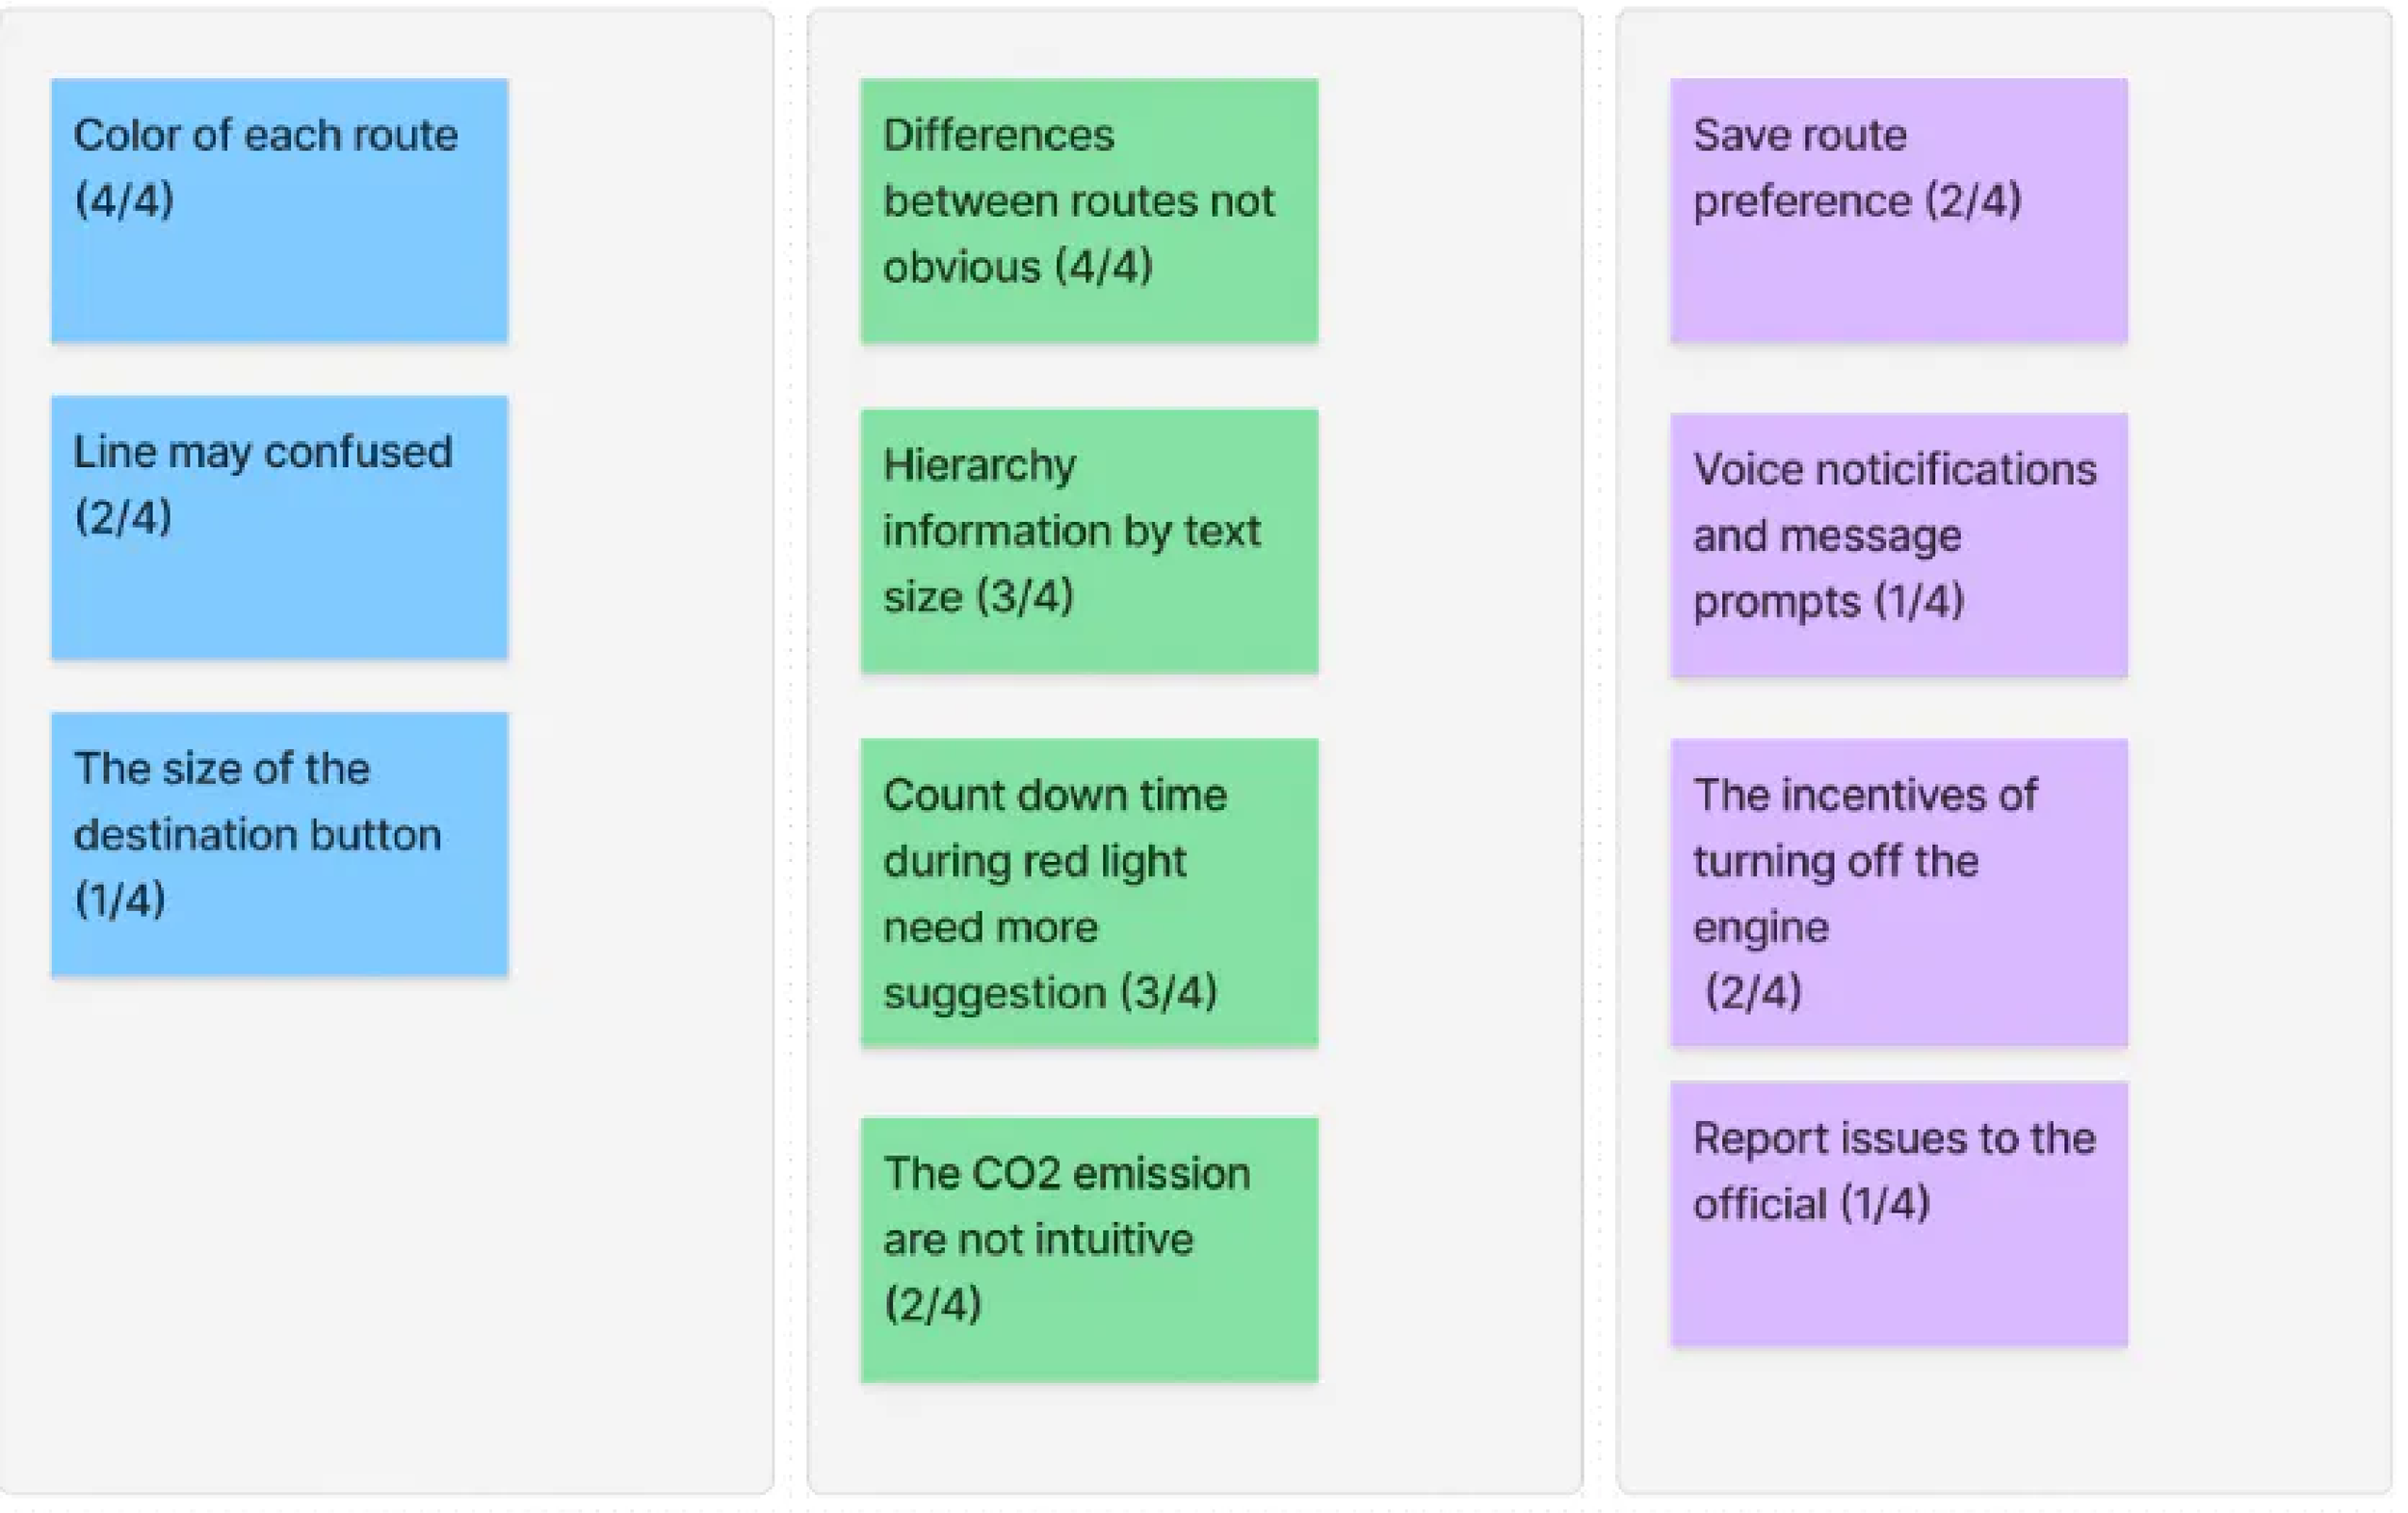
From the usability testing, we received valuable feedback from our four participants. Overall, most of the participants were amazed at our UI design and program flow and they also suggested some small UI tweaks that could make our app easier to navigate.
Key Takeaways:
The Colors and differences of each route are confusing for a new user.
Lack of the countdown and turn-off engine hint during a red light.
Confusing or not clear with the size, shape, or color of some icons.
Users want some kind of reward so they are more likely to use our app.
Current functions can partly fulfill the requirements of the users. To make it easier to use, add other functions like audio, preference setting, and intuitive data.
Revised Design Goals
After the usability testing, we realized that we missed a critical part of the solution, a reward system. So we revised our design goals.
Reward System: We wanted to provide a reward system such as coupons or promotions from local stores in King County that is based on how much carbon footprint is reduced. This is a way to incentivize users to keep using our app.
Reflections
Although our team spent a long time creating the UI and the flow of the app so that the app is as intuitive as possible to the users, there are still a lot of things that we overlooked.
We realized the importance of product testing before deployment. We always go through multiple rounds of testing before releasing an update or a feature to the public. Even though the changes might be small and simple at the first glance, there are always some issues that you will never discover until you test them.
Revised Prototype
The main thing we added to the revised prototype is the reward system that responds to the usability testing participants’ requests. We could provide a coupon on gas if the user successfully completed a certain amount of green routes so that we can encourage users to use our app.
Overall Reflections
I used to think design thinking is just a rigid process that UX designers have to go through to complete a project. After taking this course, I got a better understanding of design thinking. In my opinion, design thinking is an iterative process in which you seek to understand your users, challenge assumptions, redefine problems and create innovative solutions which you can prototype and test. The overall goal is to identify alternative strategies and solutions that are not instantly apparent with your initial level of understanding.
During this course, I faced two main challenges:
I found drafting my first design question surprisingly challenging. From my previous job experiences where the focus was trying to solve as many problems at once, I had to shift my mindset and focus on 1 need and 1 insight only.
The process of narrowing down a problem to the root cause is something I wasn’t able to do prior to taking this course. For instance, if I want to know what users want and need, I used to just go online and look for answers. Now I know doing surveys, interviews, and usability tests are the correct ways to go.
However, with Sarah and all the TAs’ guidance, I was able to push our team project forward with my teammates to somewhere that seems kind of close to a workable solution. This course helps me not only with the tasks I will be doing at my future workplace but also with every ambiguous challenge that I will be facing in life.
