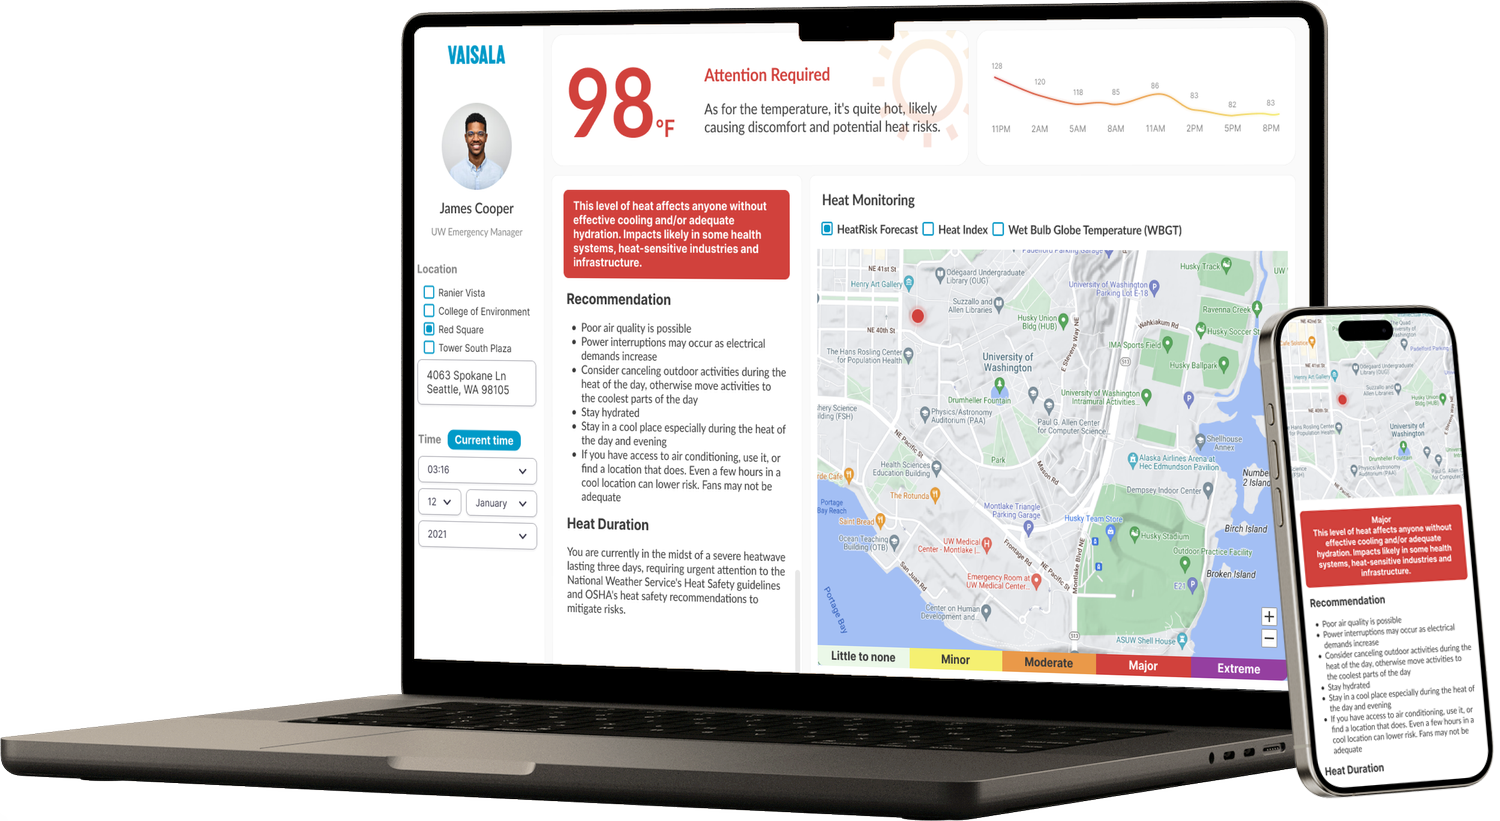
An intuitive dashboard that provides accurate hyper-local temperature which enhances decision-making and insights for the University of Washington Emergency Management.
Sponsored by:
Timeline
September 2023 - March 2024
My Role
Product Manager, Product Designer
Project Type
To B team project sponsored by Vaisala
Deliverables
Problem
Emergency managers currently lack effective ways to make the best decision during heat events.
Emergency managers often respond based on the overall city climate report, disregarding the distinct microclimates that can vary considerably across different areas within the city.
Solution
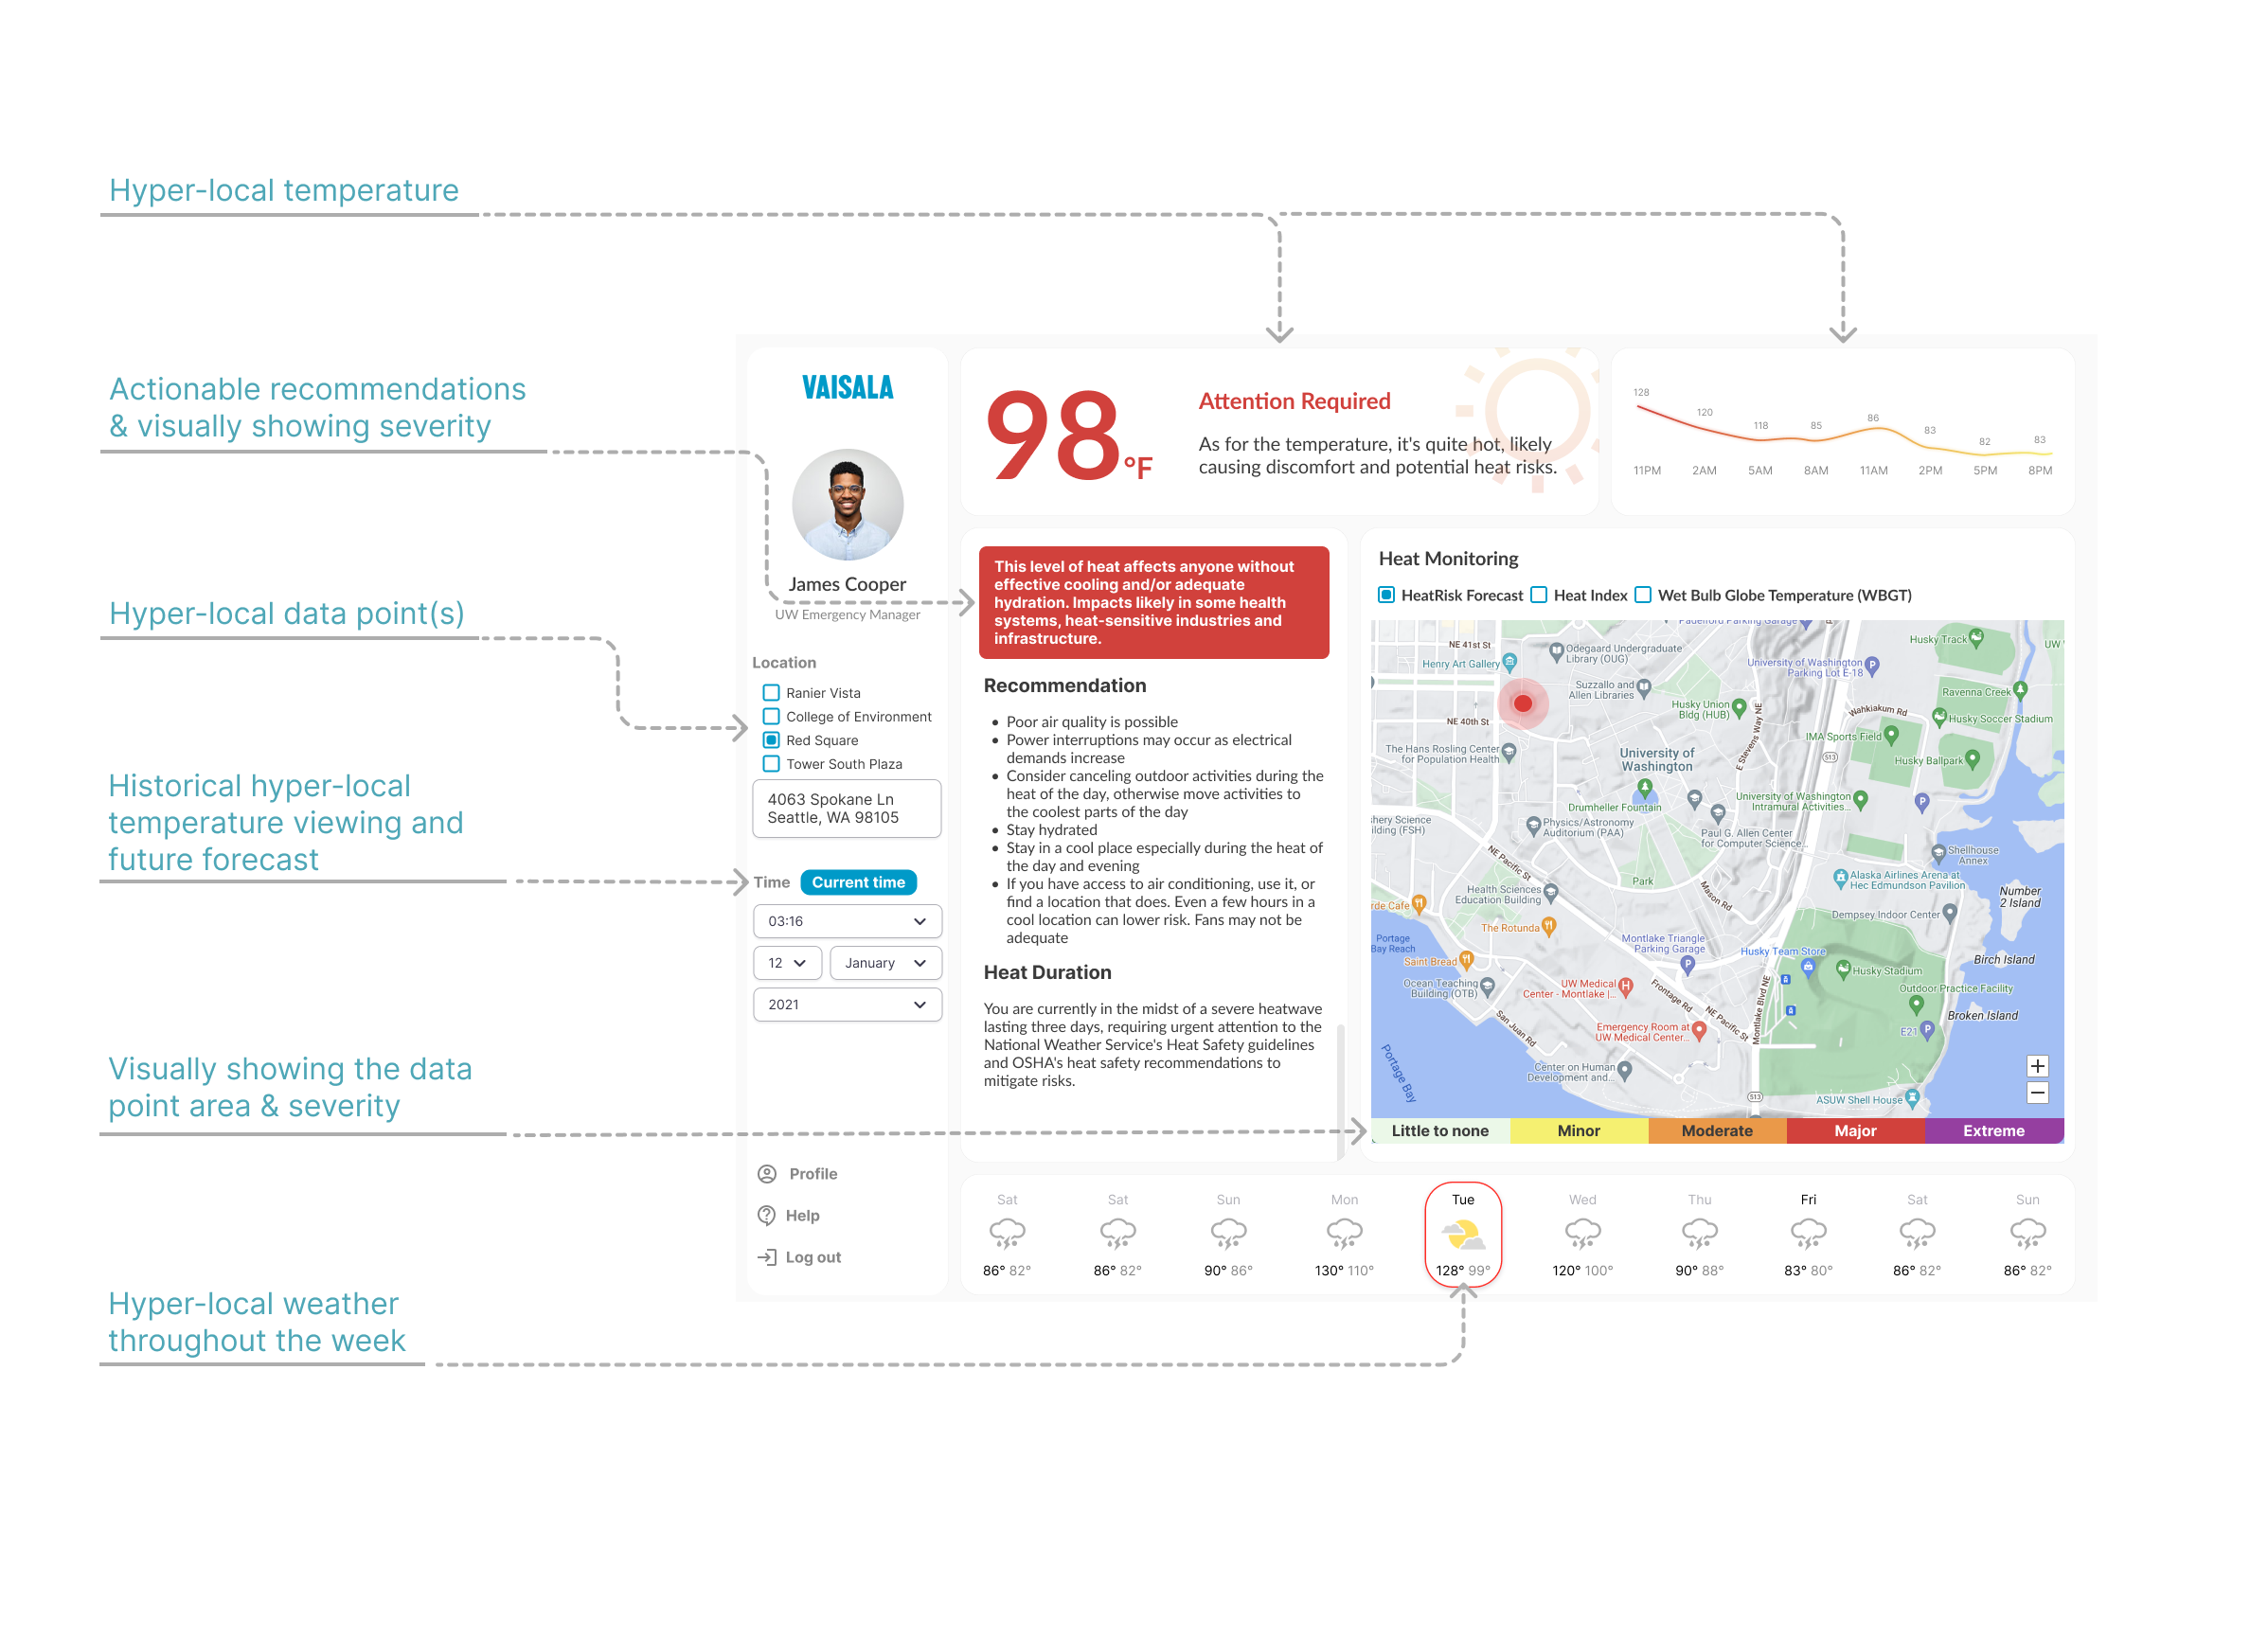
With Vaisala's TempCast sensor and critical temperature metrics, we created a comprehensive temperature dashboard empowering decision-makers to receive localized, accurate, and real-time weather insights to make informed decisions, optimize resource allocation, and enhance preparedness for various temperature-related scenarios.
Process
Impact
When a heat event occurs, UW Emergency Management traditionally holds extensive meetings with specialists from UW Public Health, UW Medicine, UW Environmental Health & Safety, and five other departments before making critical decisions. Our XWeather dashboard streamlines this process by integrating diverse departmental thresholds and automatically generating comprehensive, data-driven recommendations. This significantly reduces decision-making time, enabling faster, more informed responses to extreme weather events.
Our secondary research aims to:
Validate and refine our hypothesis by exploring the market demand, competitive landscape, technological trends, and potential user base for hyper-local weather information services.
Insight 2 - Heat exposure duration is overlooked
Current approaches to heat exposure often overlook the crucial factor of exposure duration, focusing primarily on heat intensity and Wet-bulb temperature. There is a study that suggests further research to determine the appropriate weighting of intensity versus duration in the new heat exposure metric.
Insight 3 - A new microclimate data collection methodology is needed for a more effective heat response plan.
Currently, urban leaders lack of region-specific data for making effective heat response plans and maintaining effective communication strategies.
Utilizing Current Sensor Data:
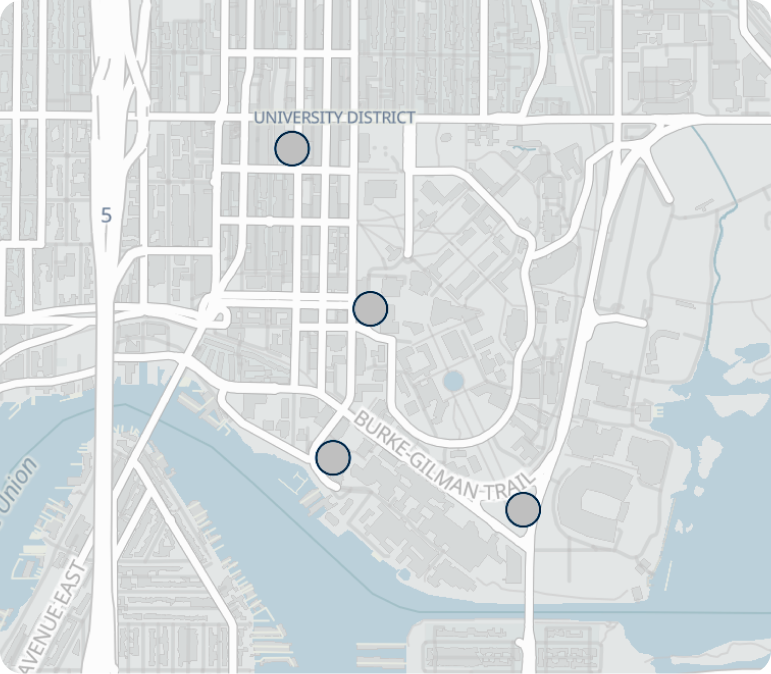
Our sponsor, Vaisala, deployed four Tempcast sensors on the University of Washington (UW) campus during the Summer of 2022 to better understand the impact of local weather on human well-being.
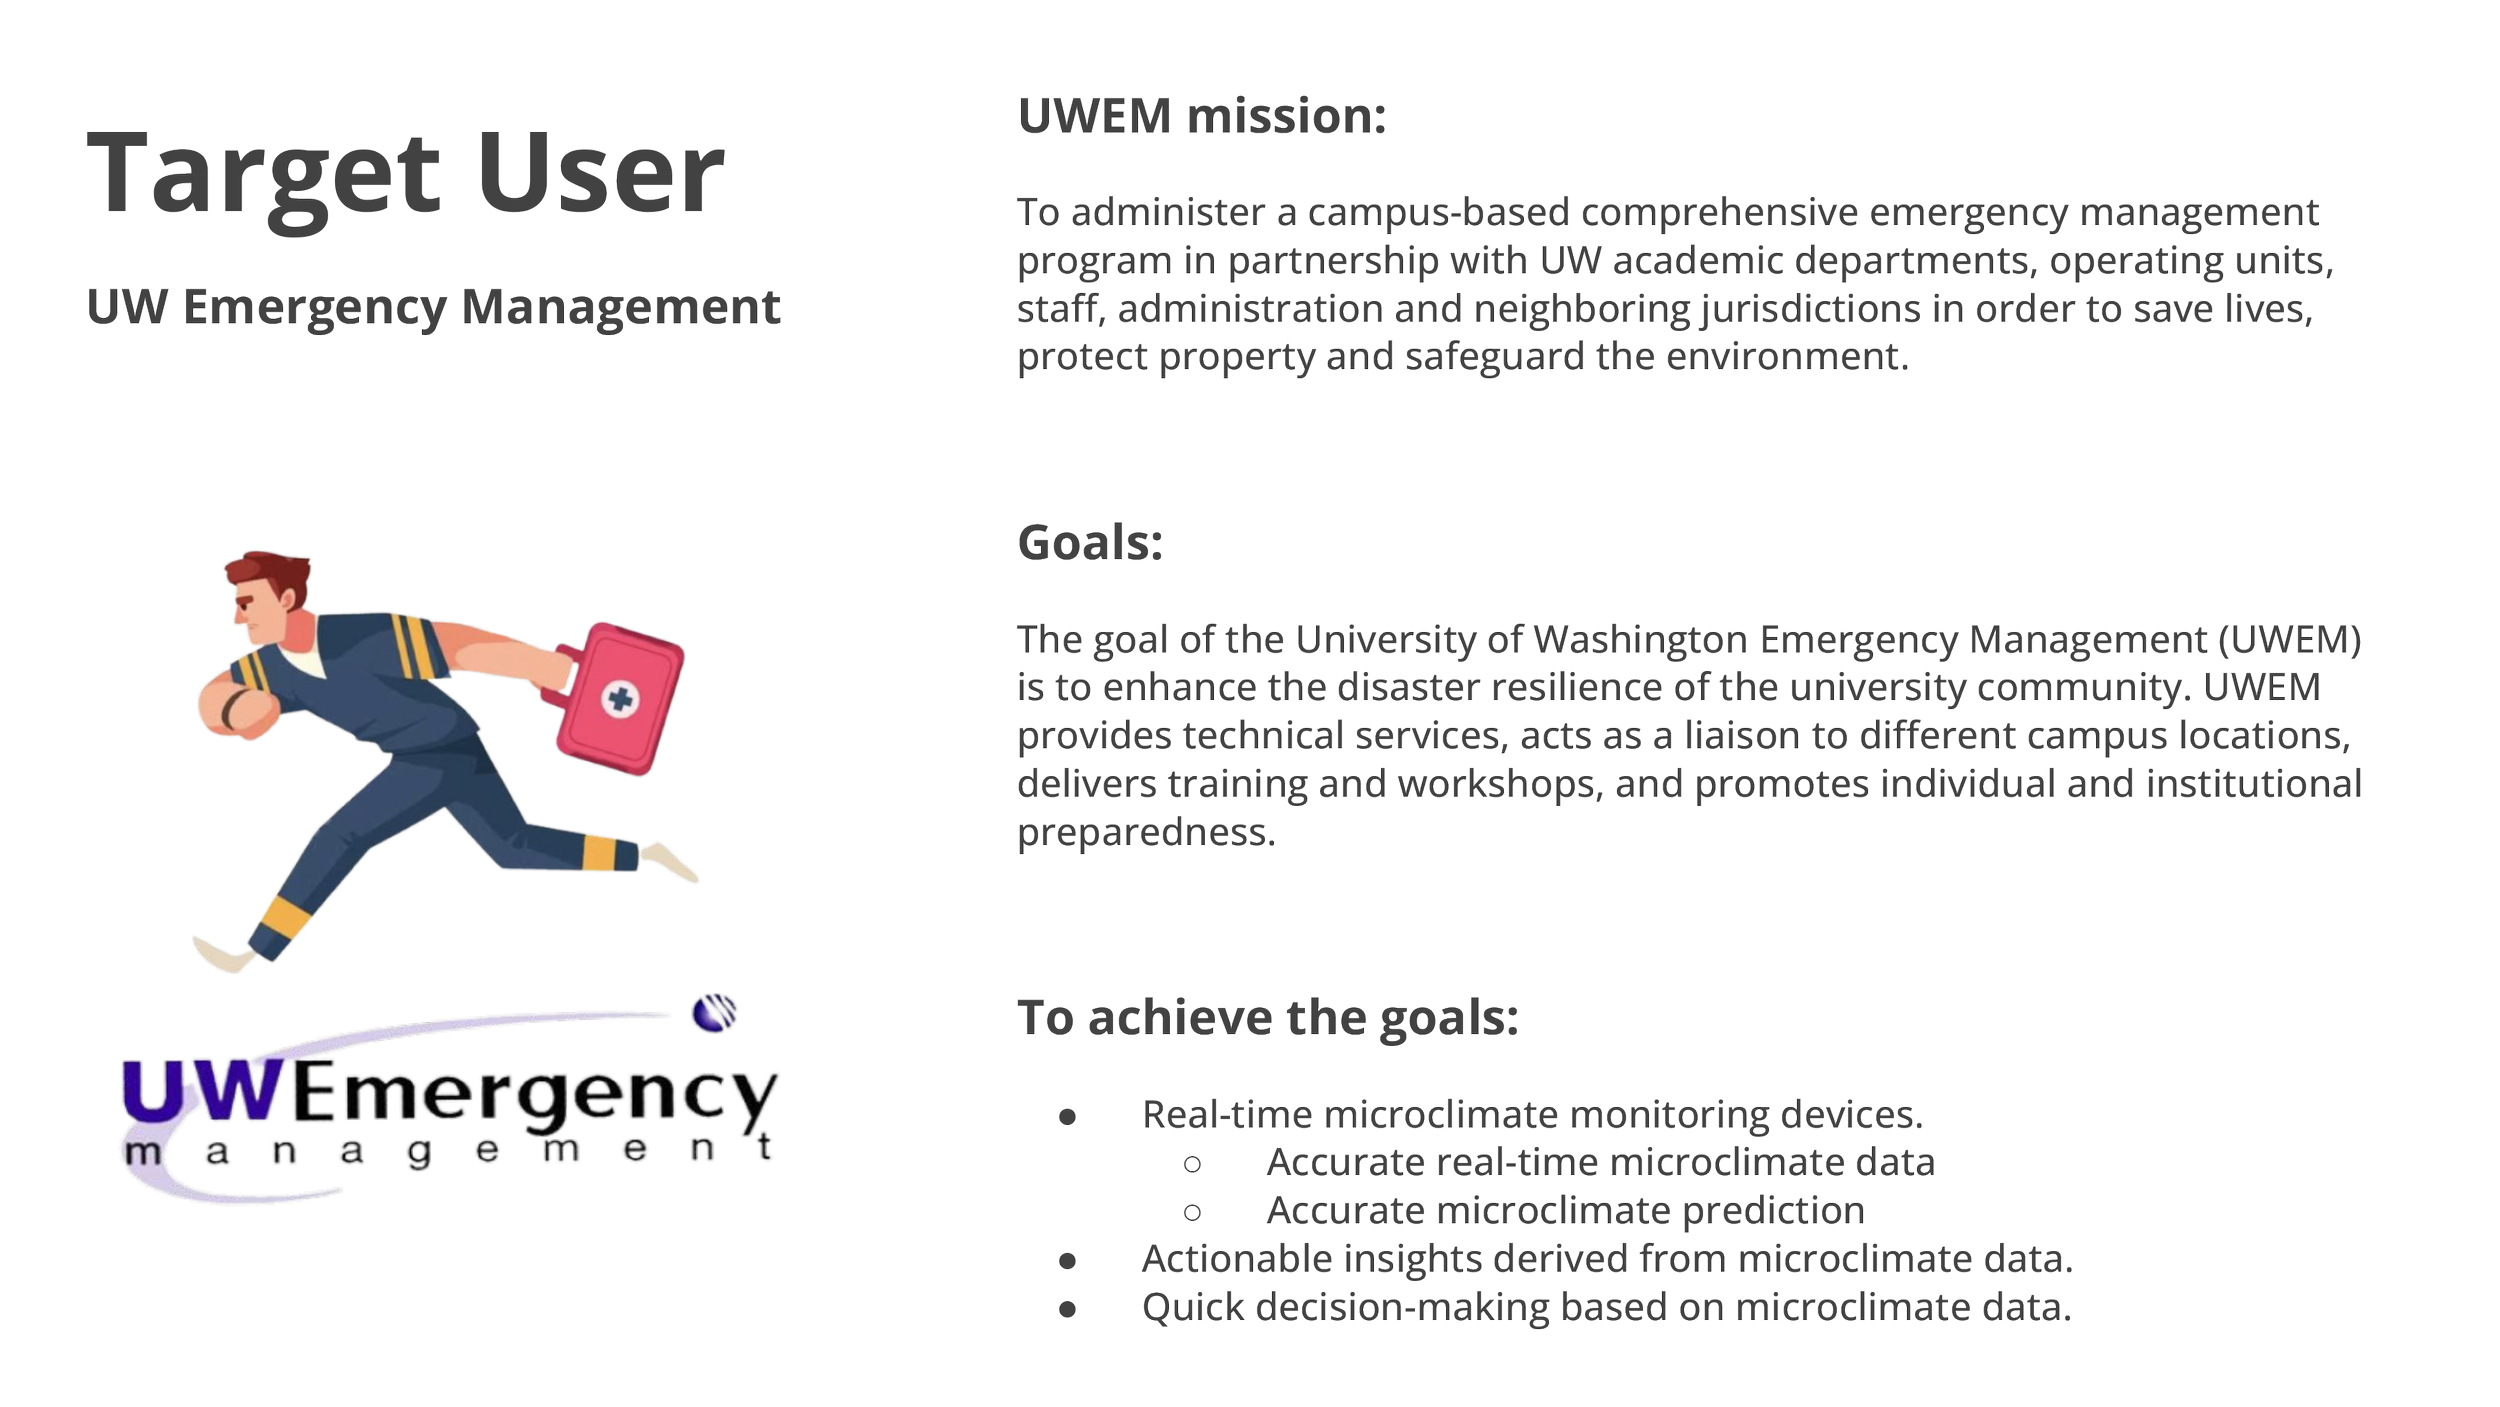
Based on the findings, we determined that utilizing these four sensors to address a relevant issue on the UW campus would be the most beneficial approach. After discussions with our professors and sponsors, we decided to develop a solution for the UW Emergency Management team.
Narrowing Down Project Scope
UW vicinity map
Design Question
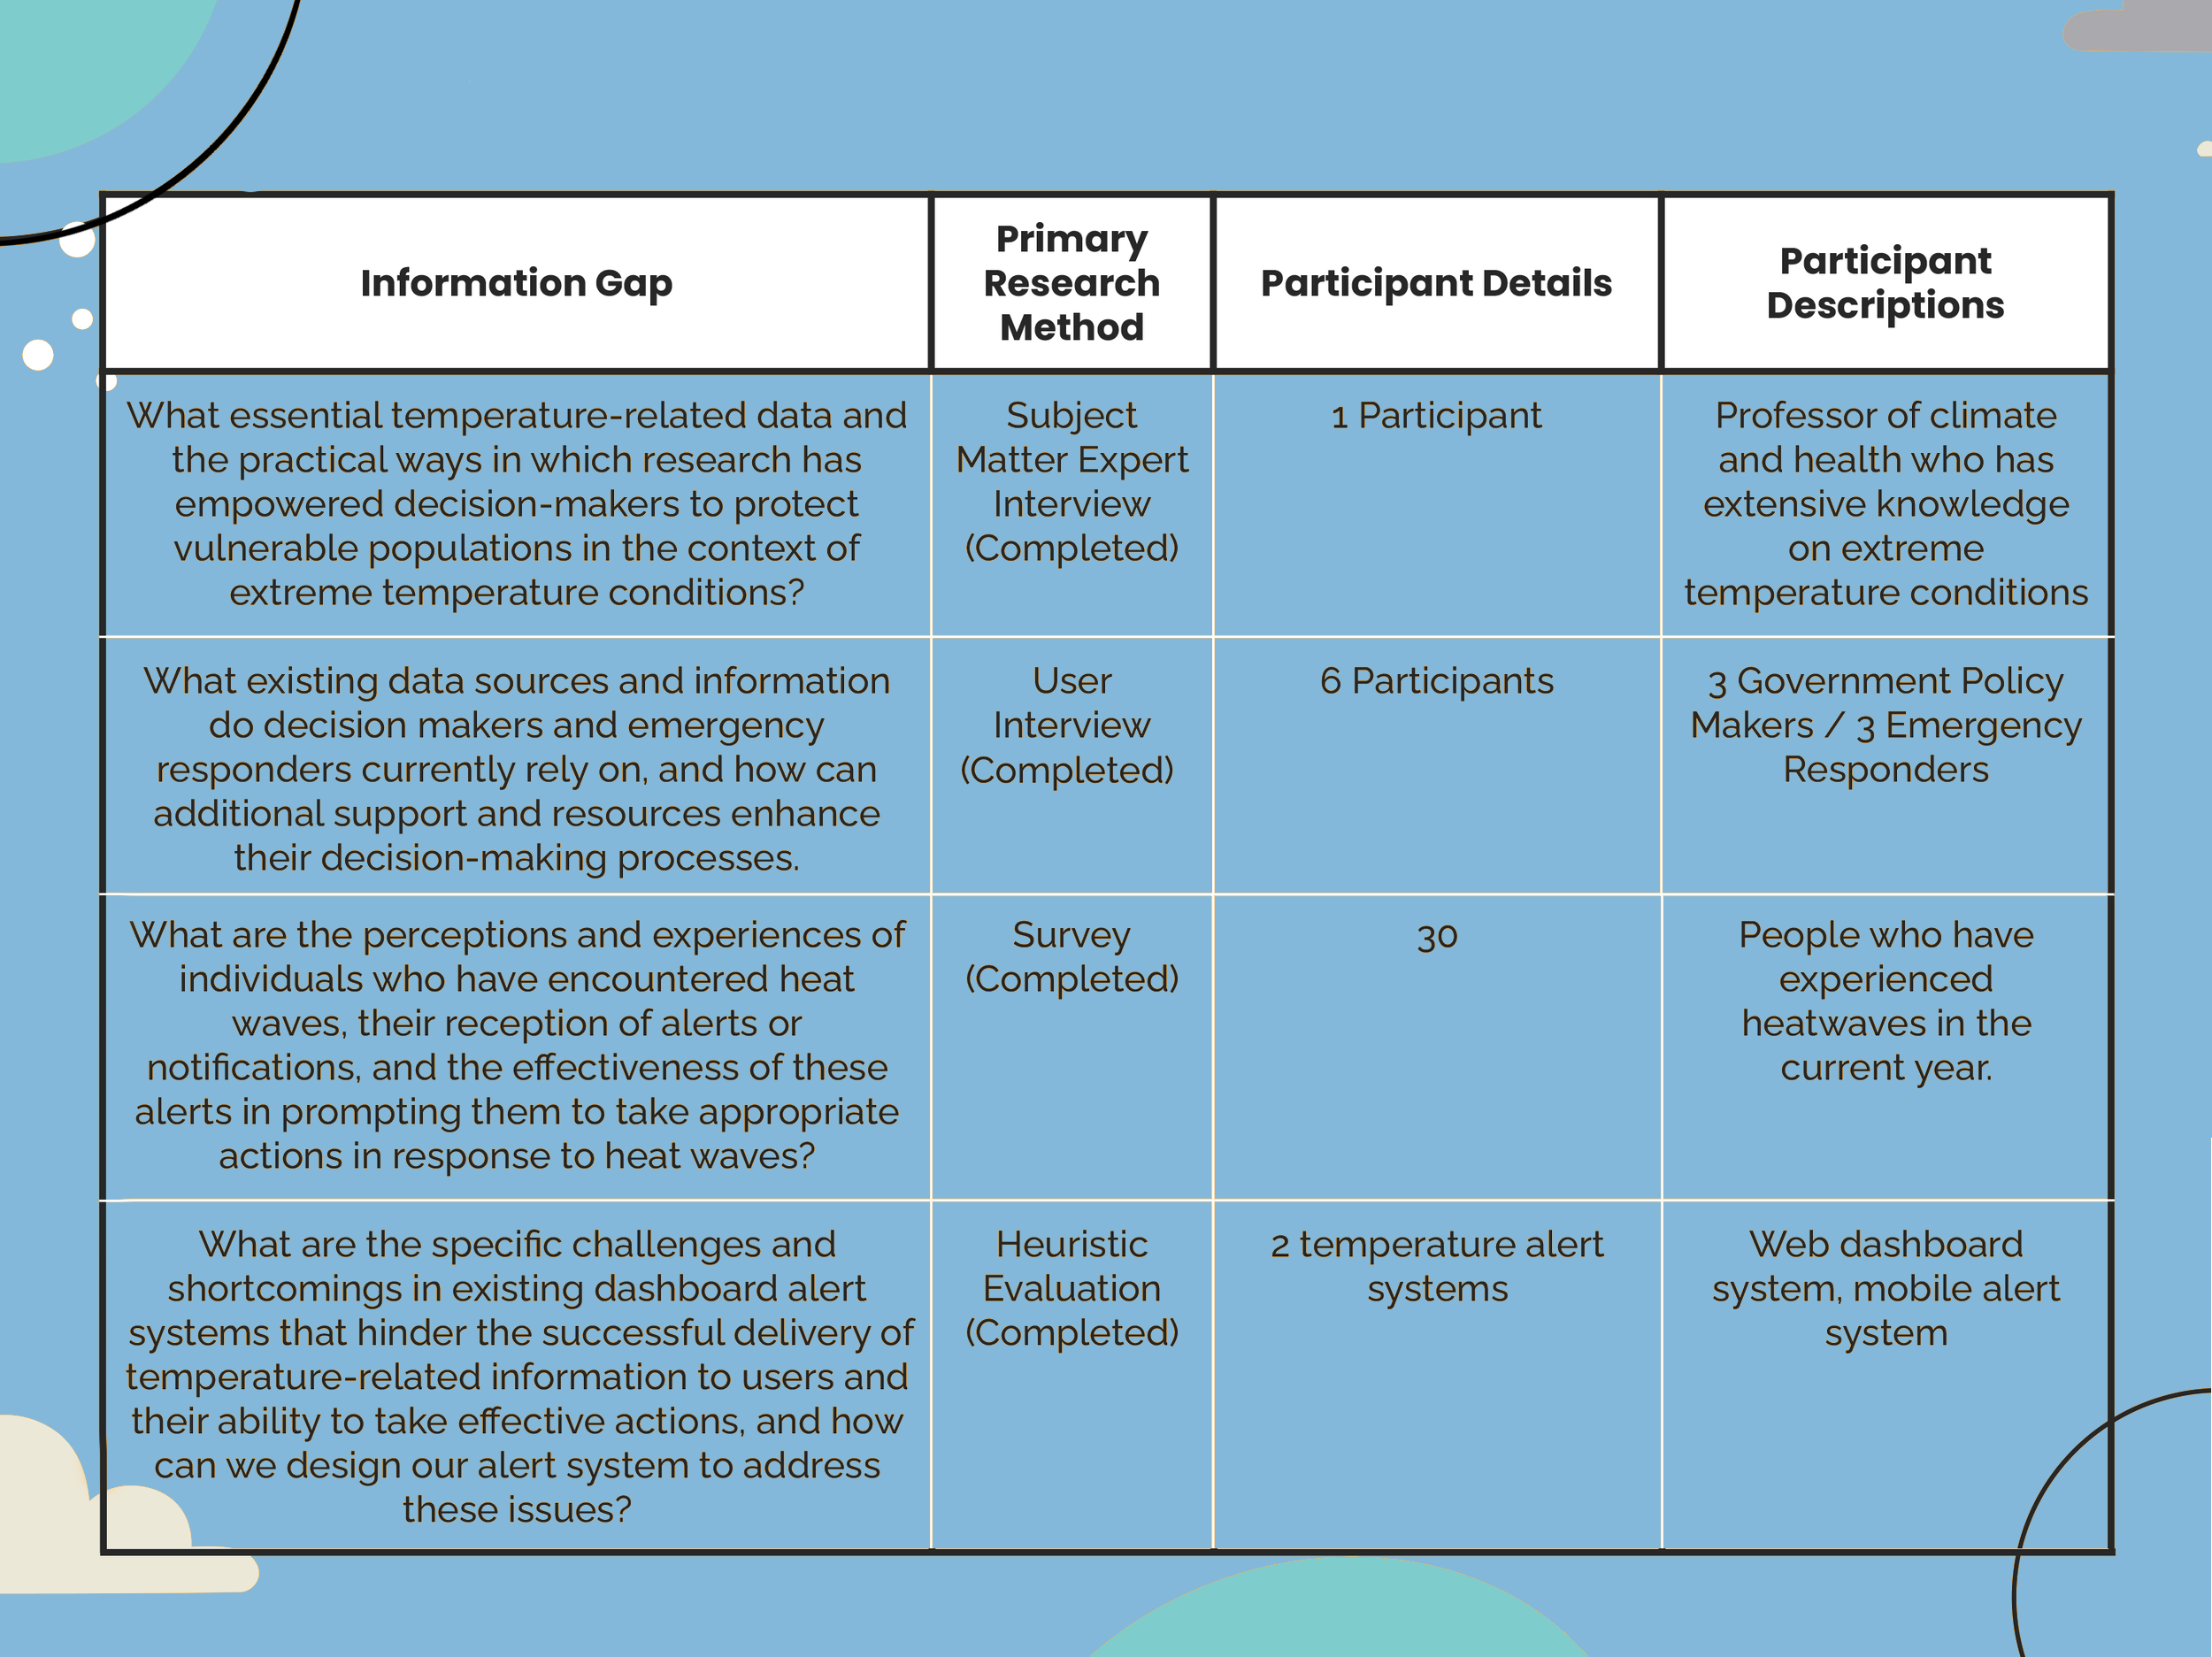
Primary Research
Our goal is to understand how data collected from Tempcast sensors can empower decision-makers to make informed and effective decisions in addressing extreme temperature-related challenges.
Primary Research Methods:
Direct to emergency responders
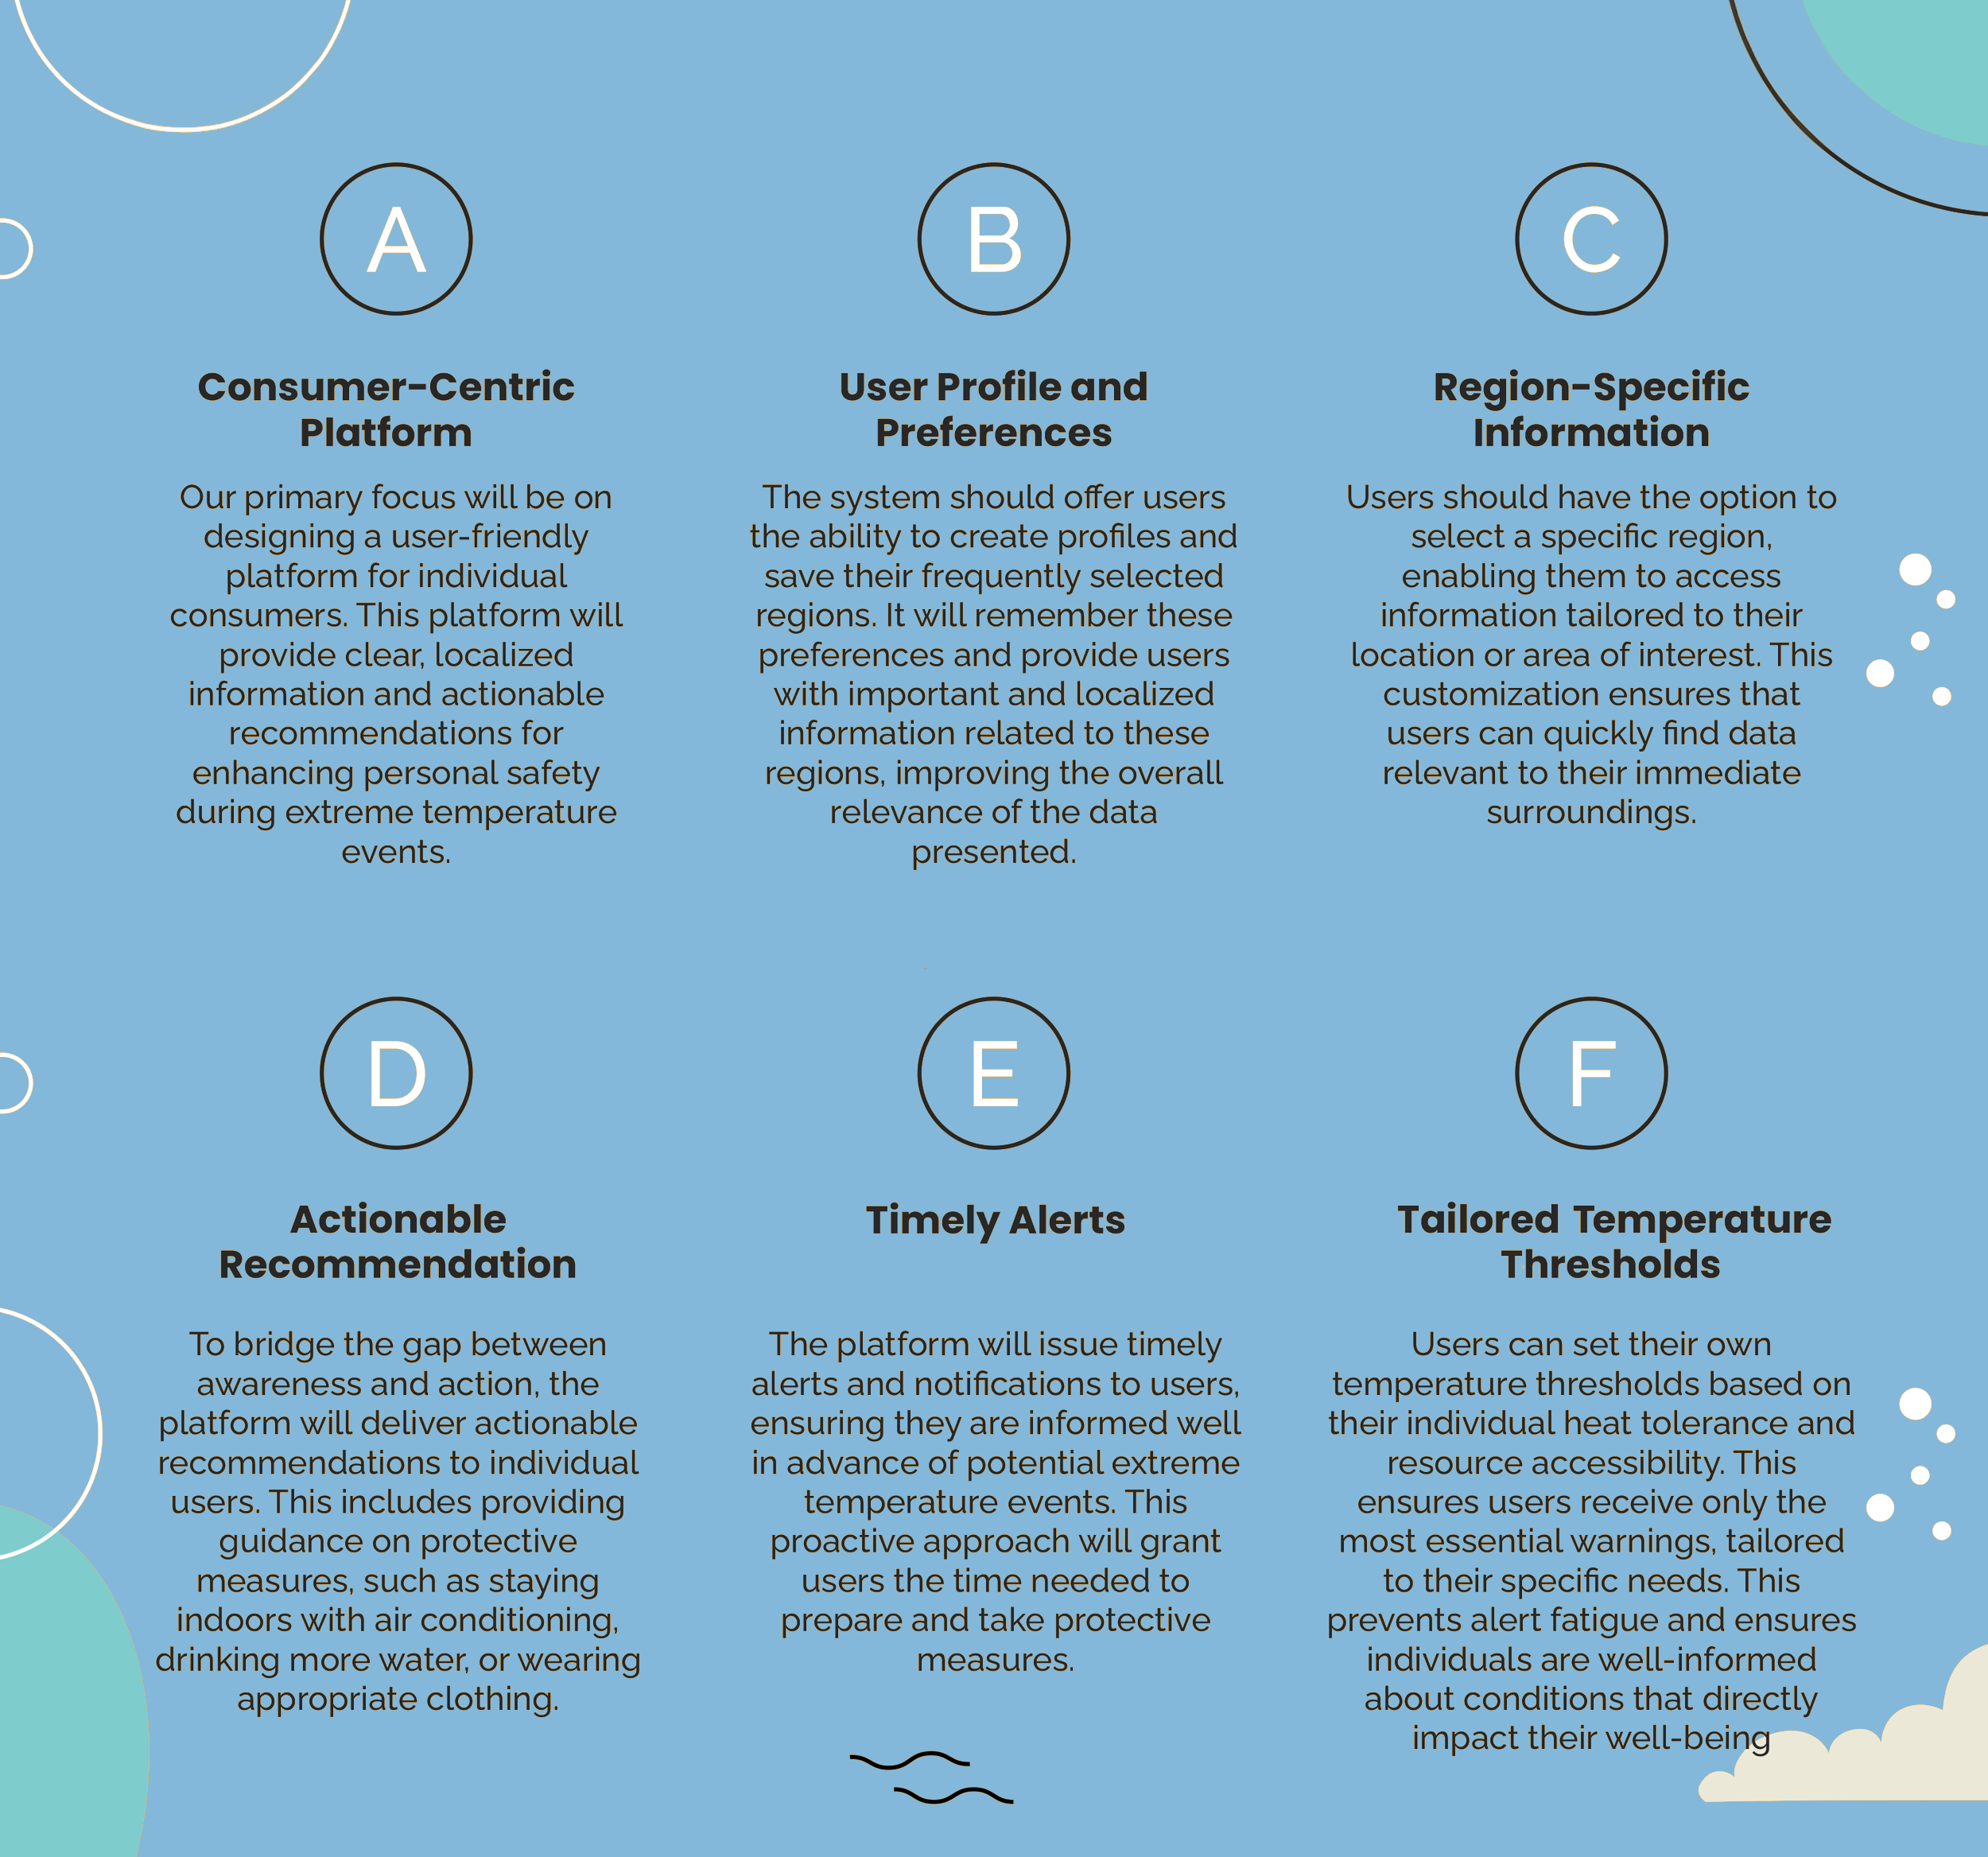
Policymakers are not well-equipped to make more informed decisions due to the reliance on standardized criteria and CDC-provided guidelines. In contrast, emergency responders make localized decisions by physically being in the environment.Actionable recommendations
There is a discrepancy between awareness and behavior where individuals do not translate their awareness into actions to protect themselves.The importance of hyper-local data
The current solutions, such as the heat-related EMR dashboard and Heat Safety Tool App, are primarily data-driven but lack a clear visual hierarchy and flexibility for user customization. Users are not provided with the means to quickly access and focus on the specific information that is most relevant to them.
Primary Research Findings:
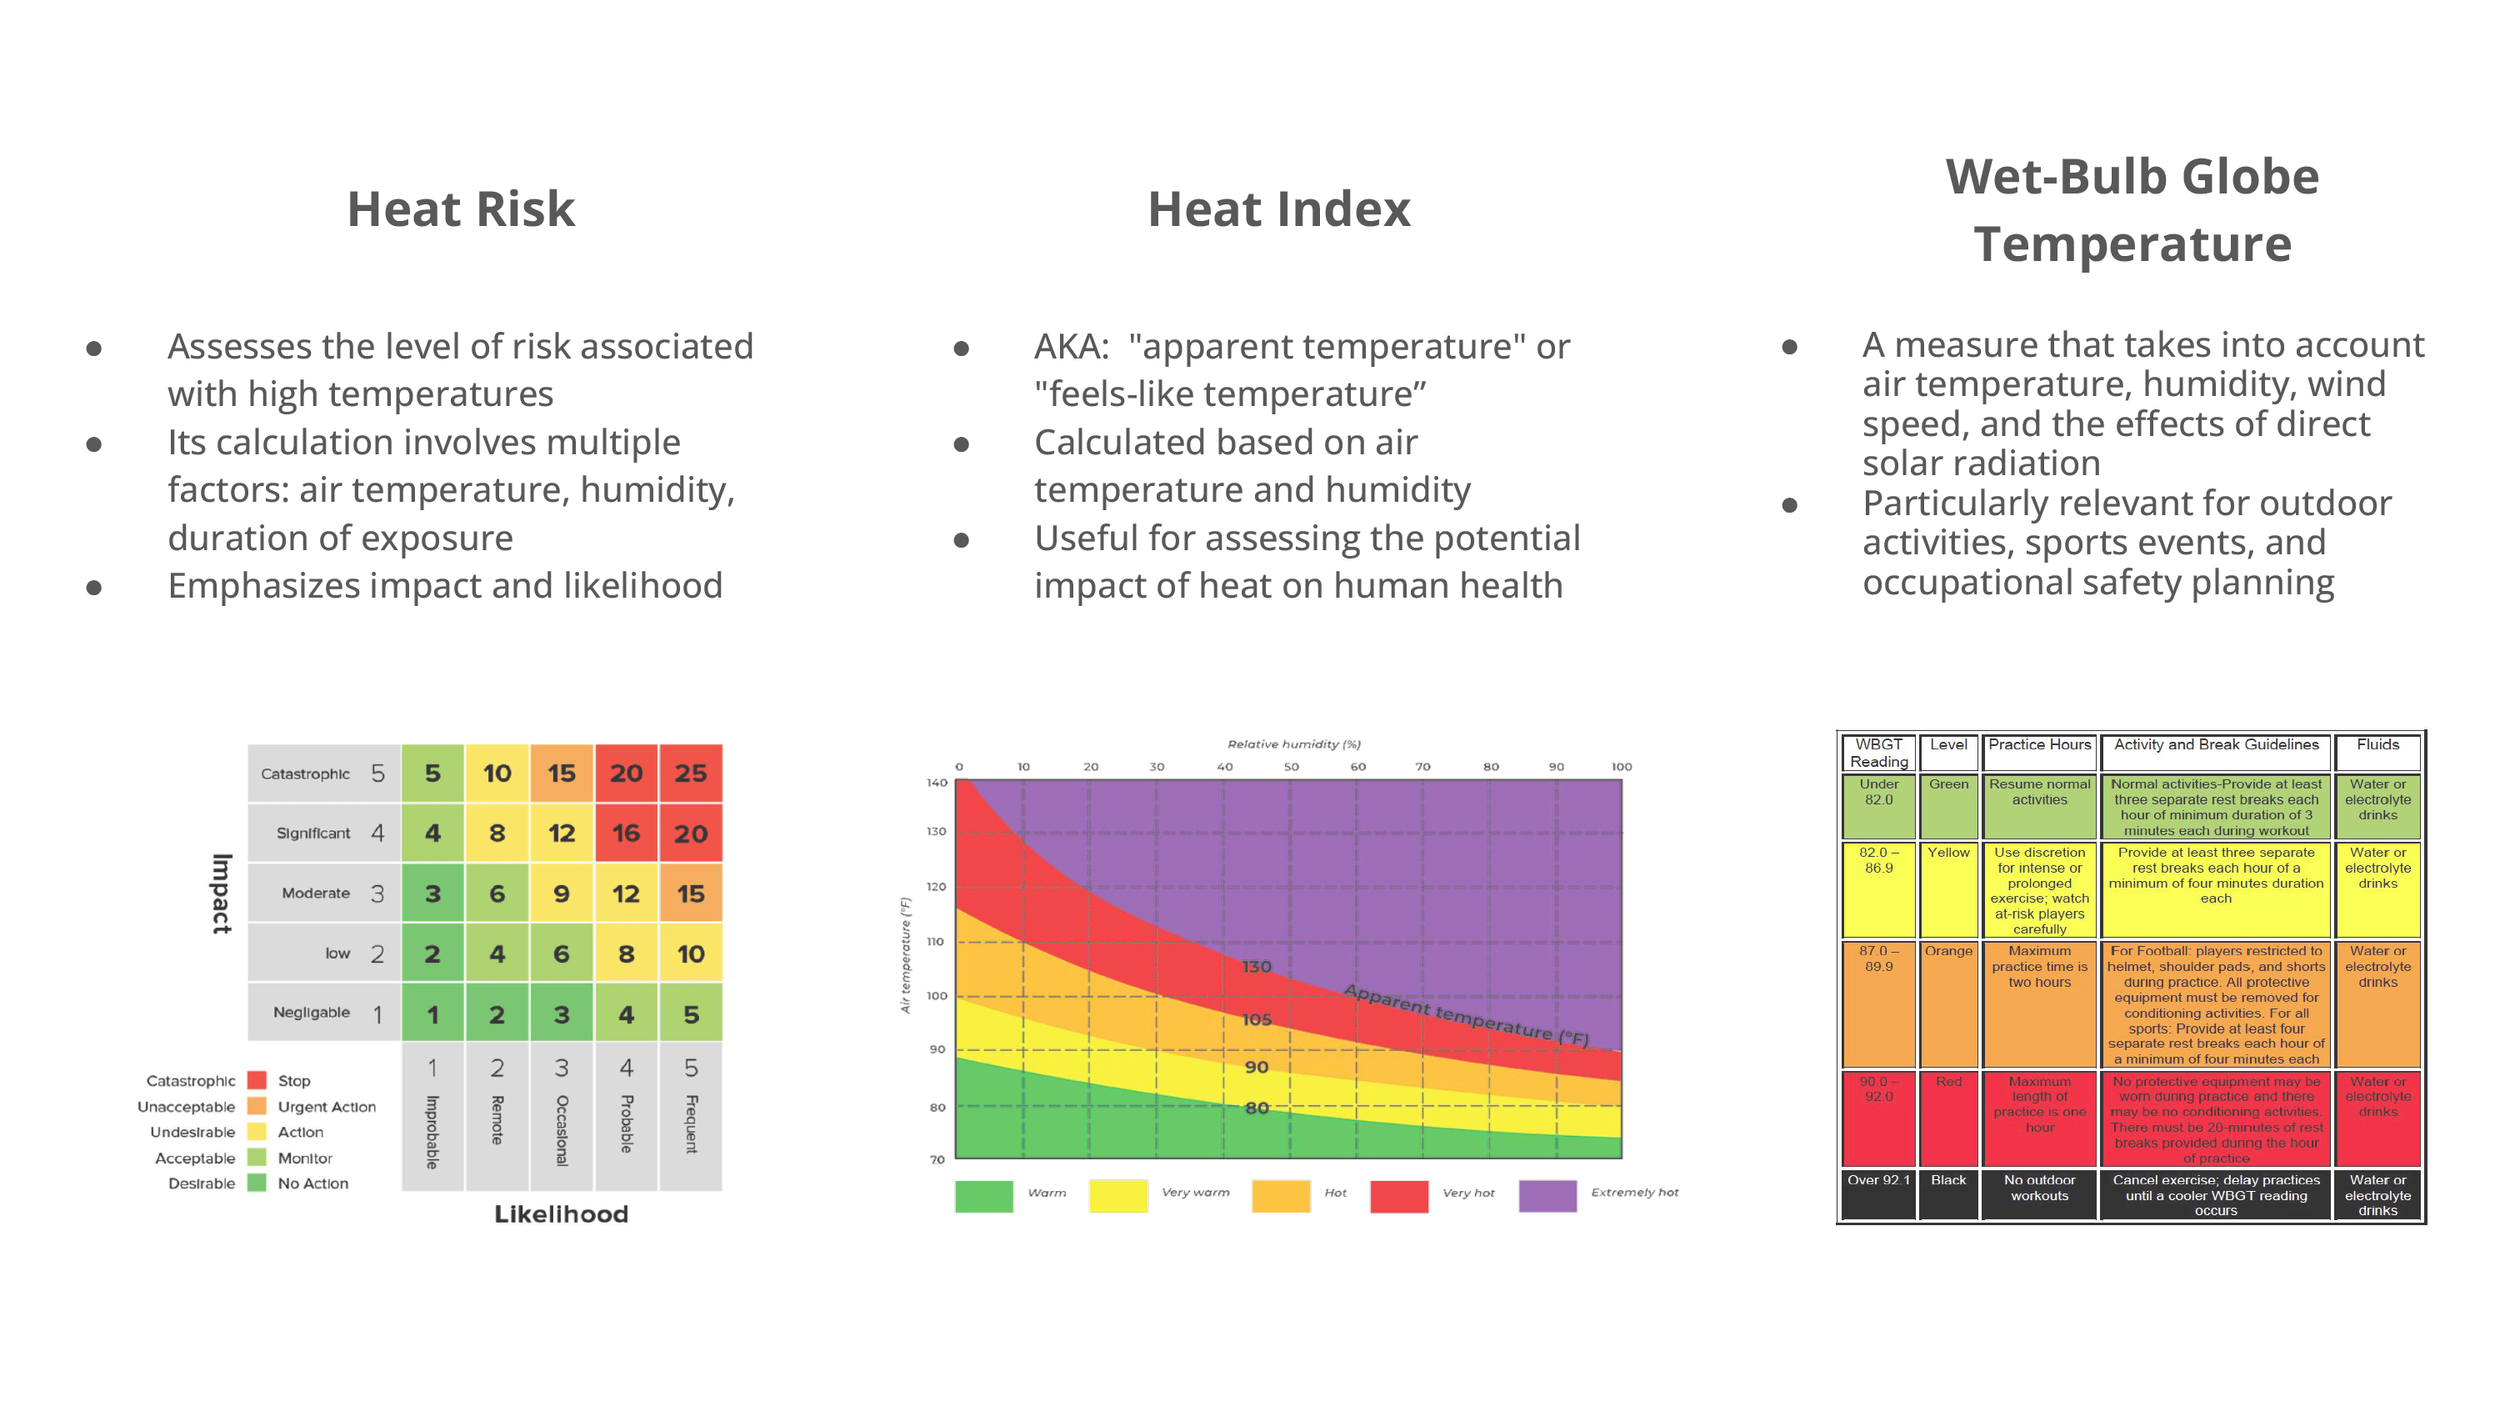
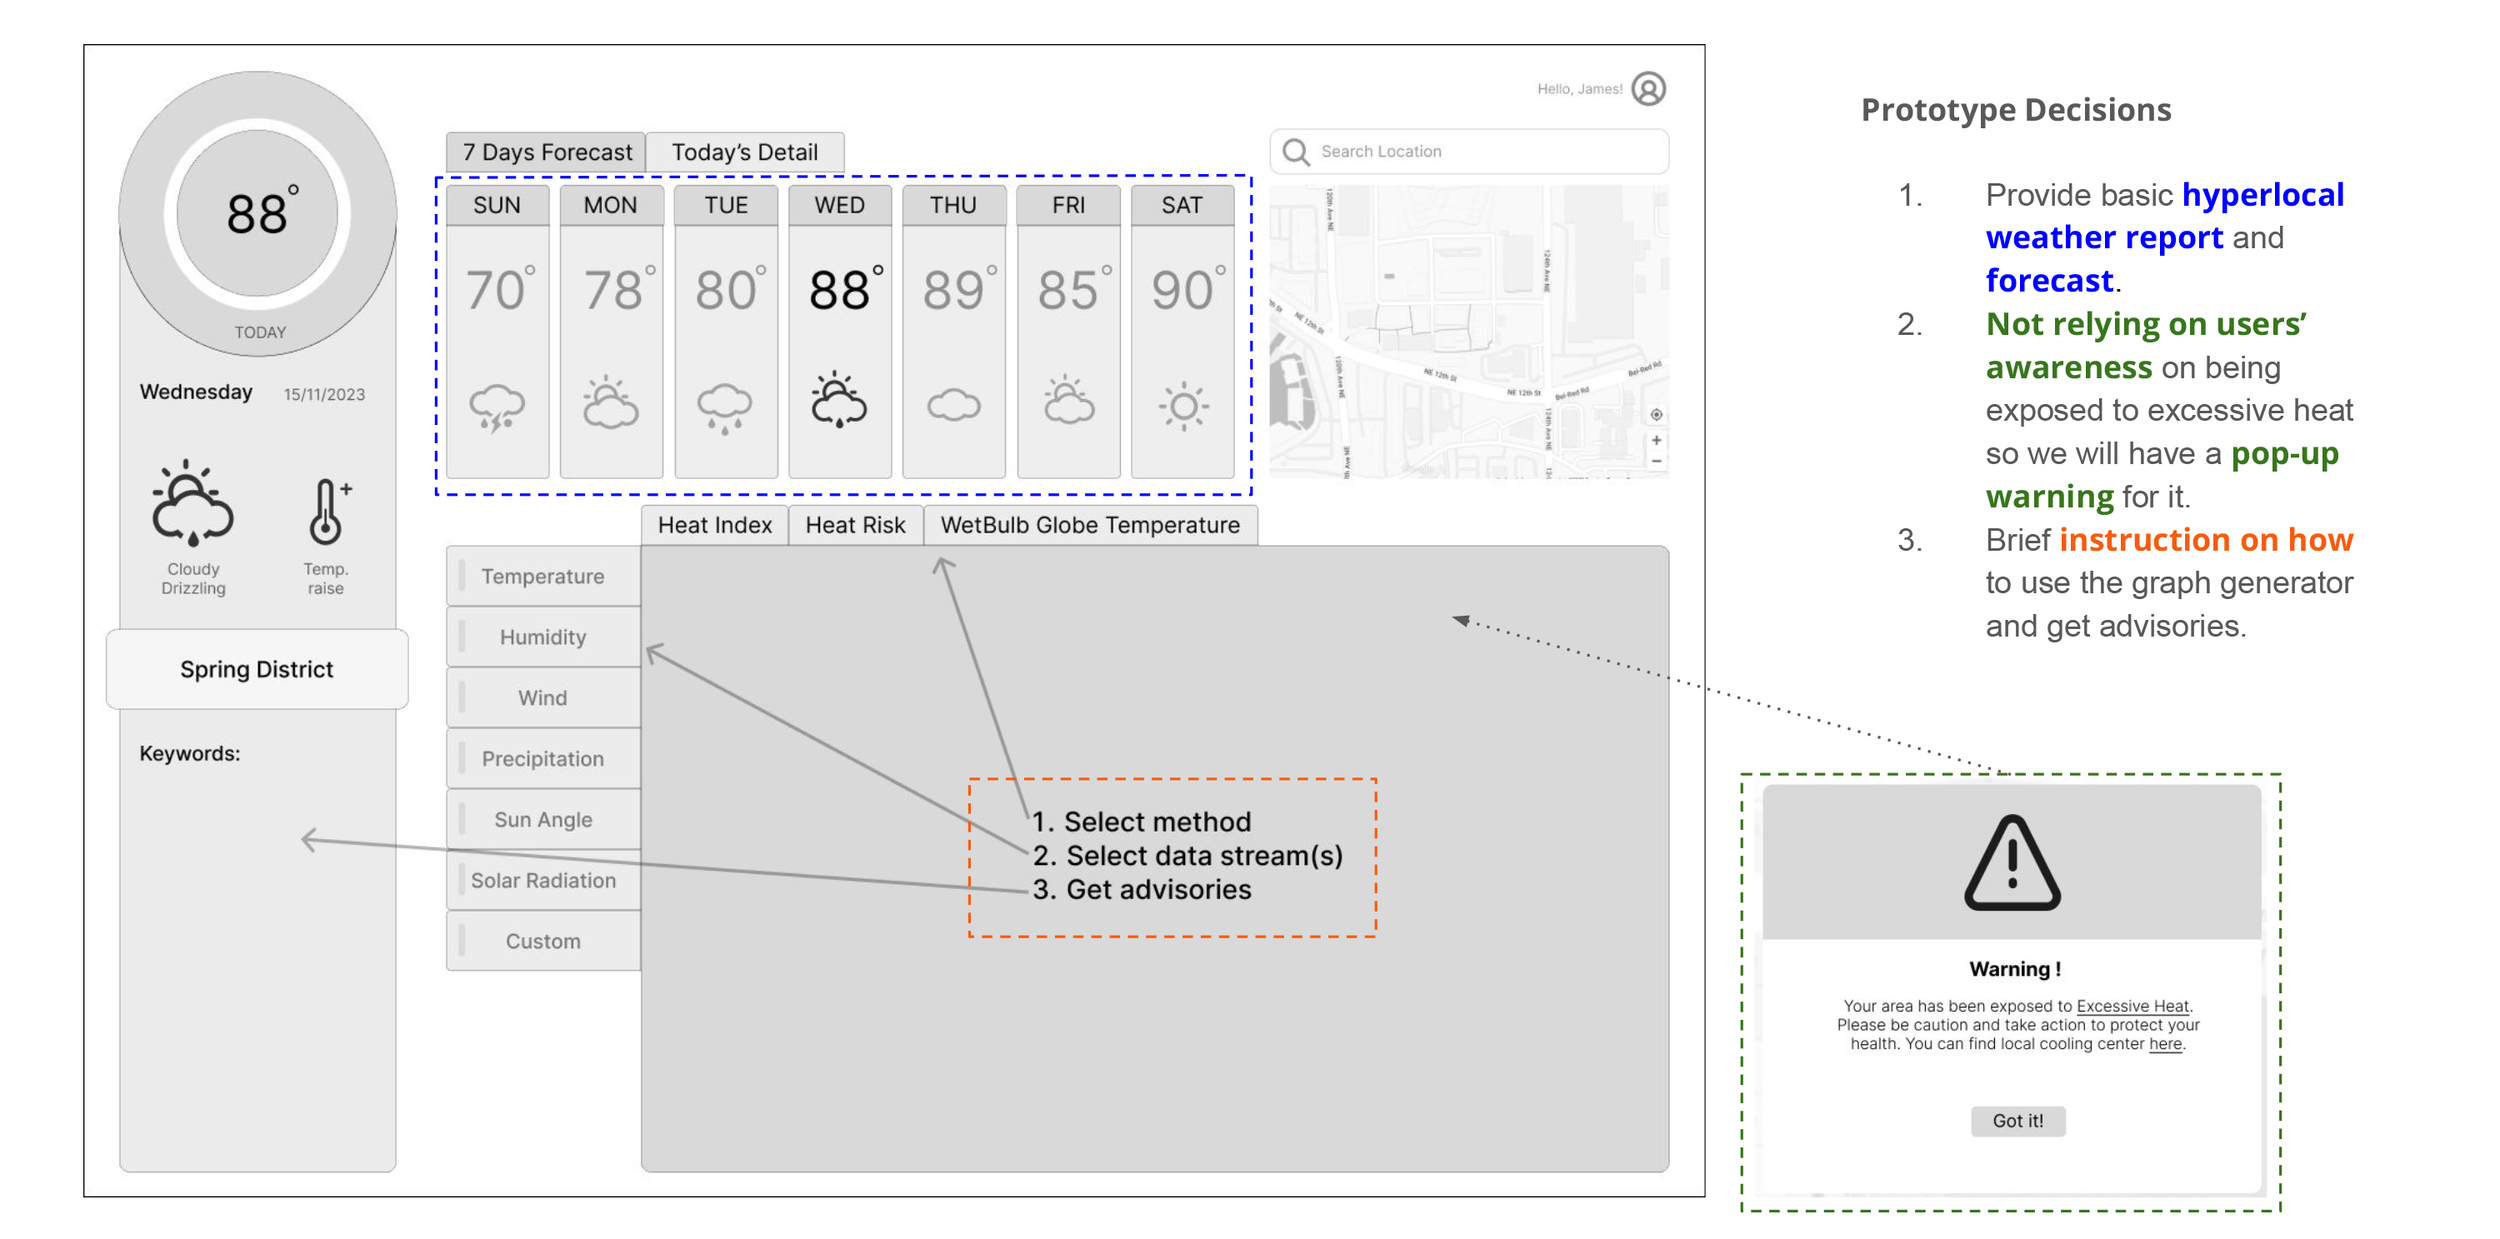
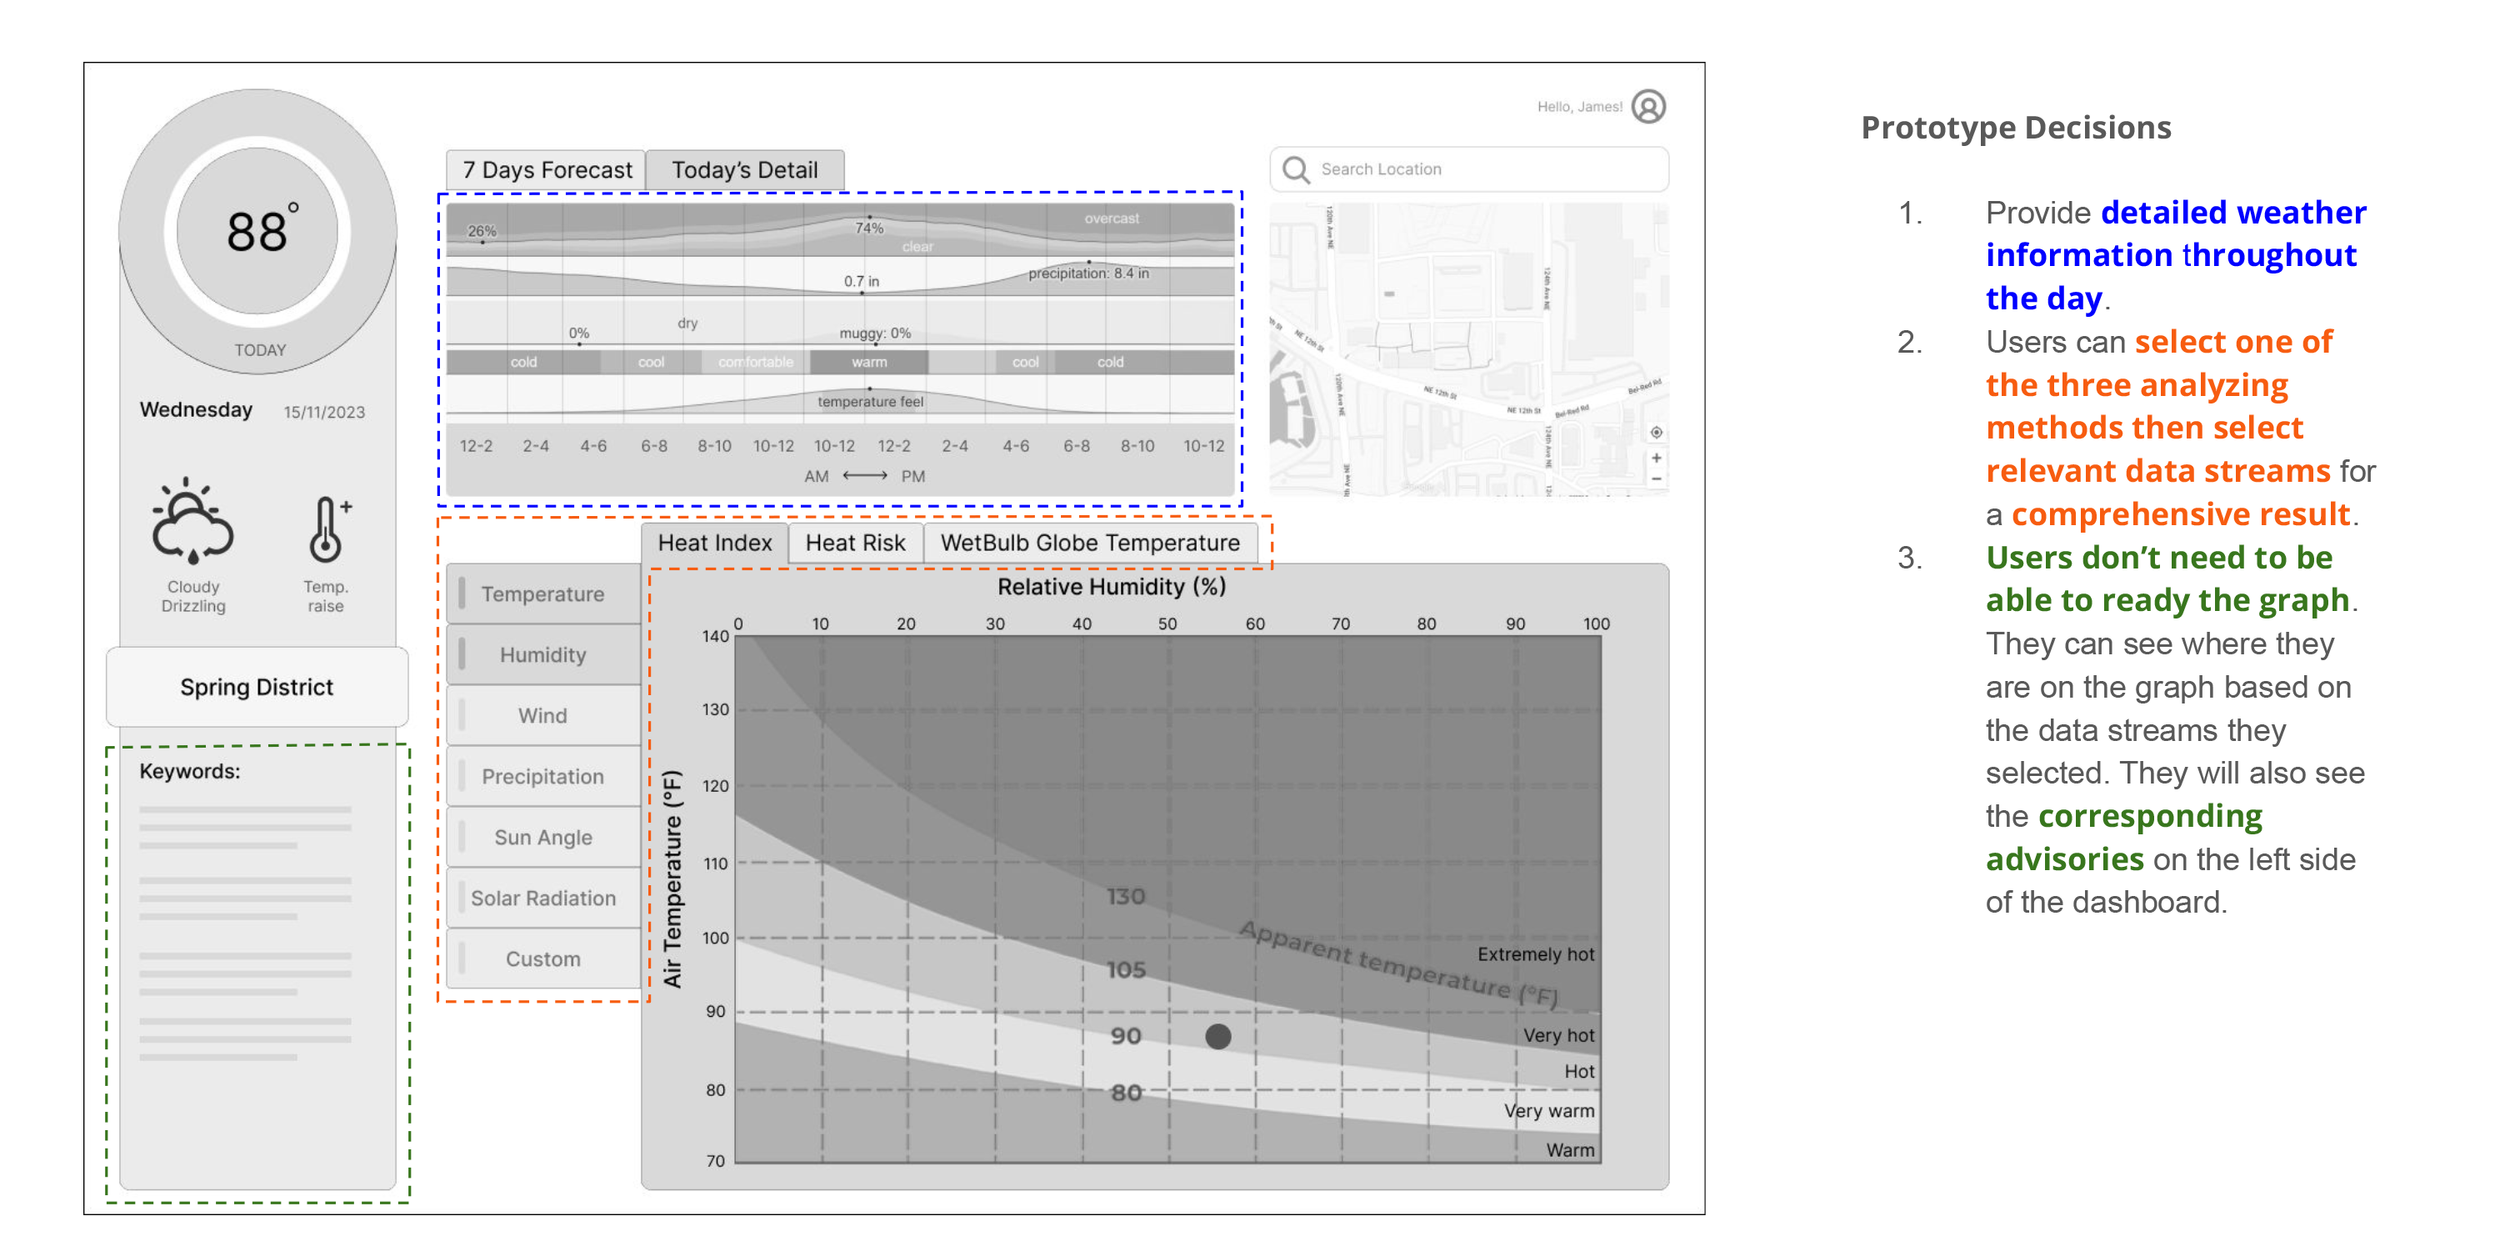
In addition to the four key findings mentioned above, decision-makers commonly use three methods to determine weather conditions: Heat Risk, Heat Index, and Wet-Bulb Globe Temperature.
Design Concepts:
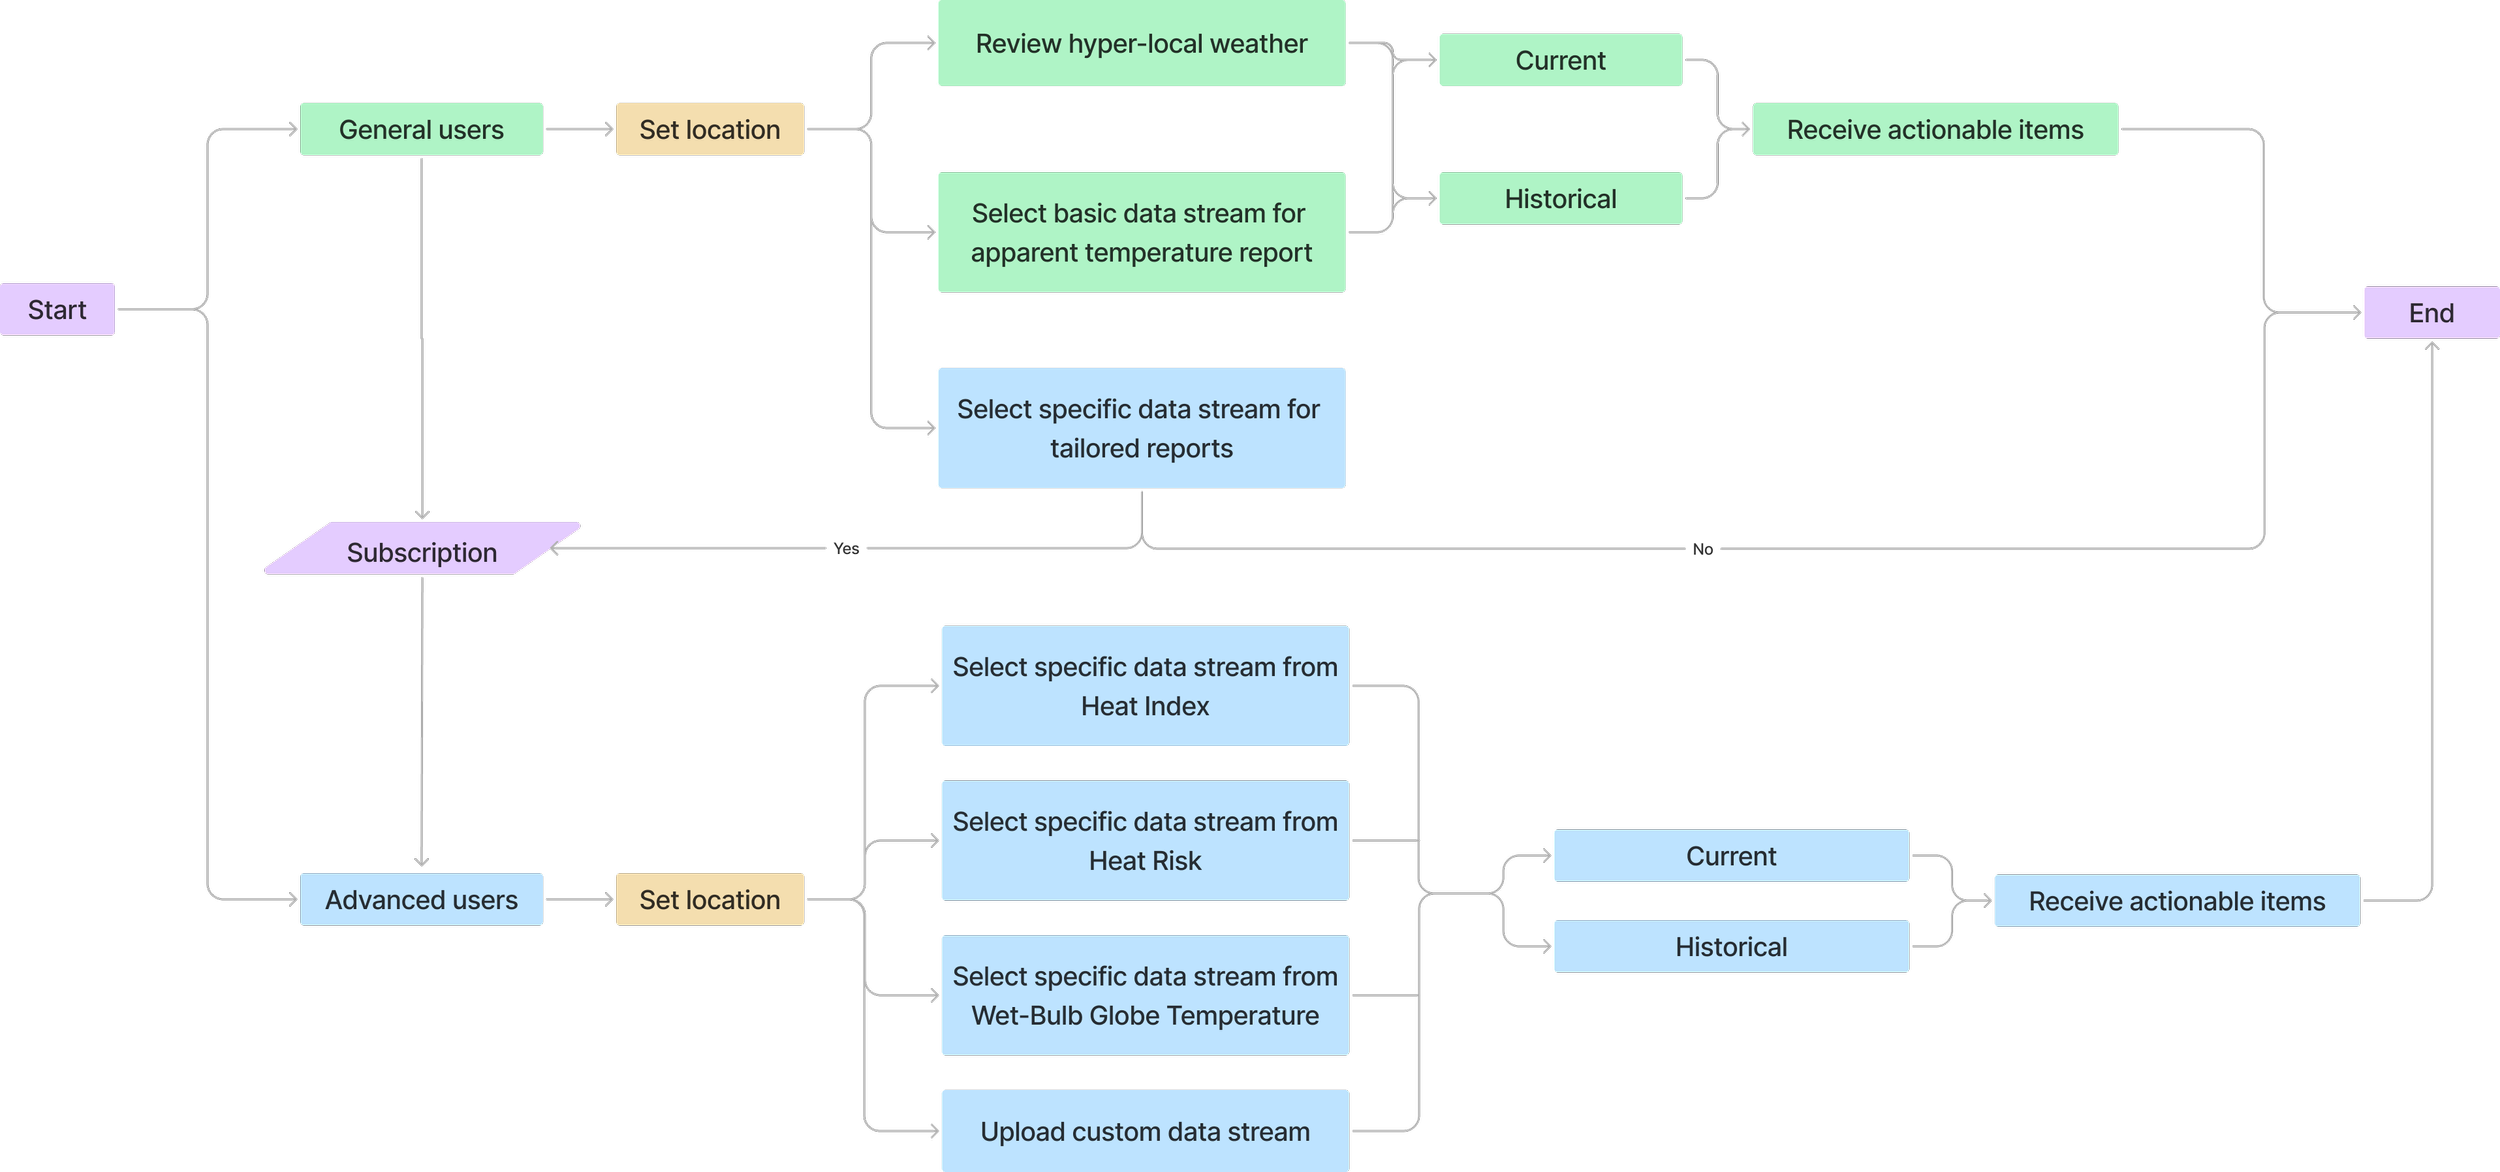
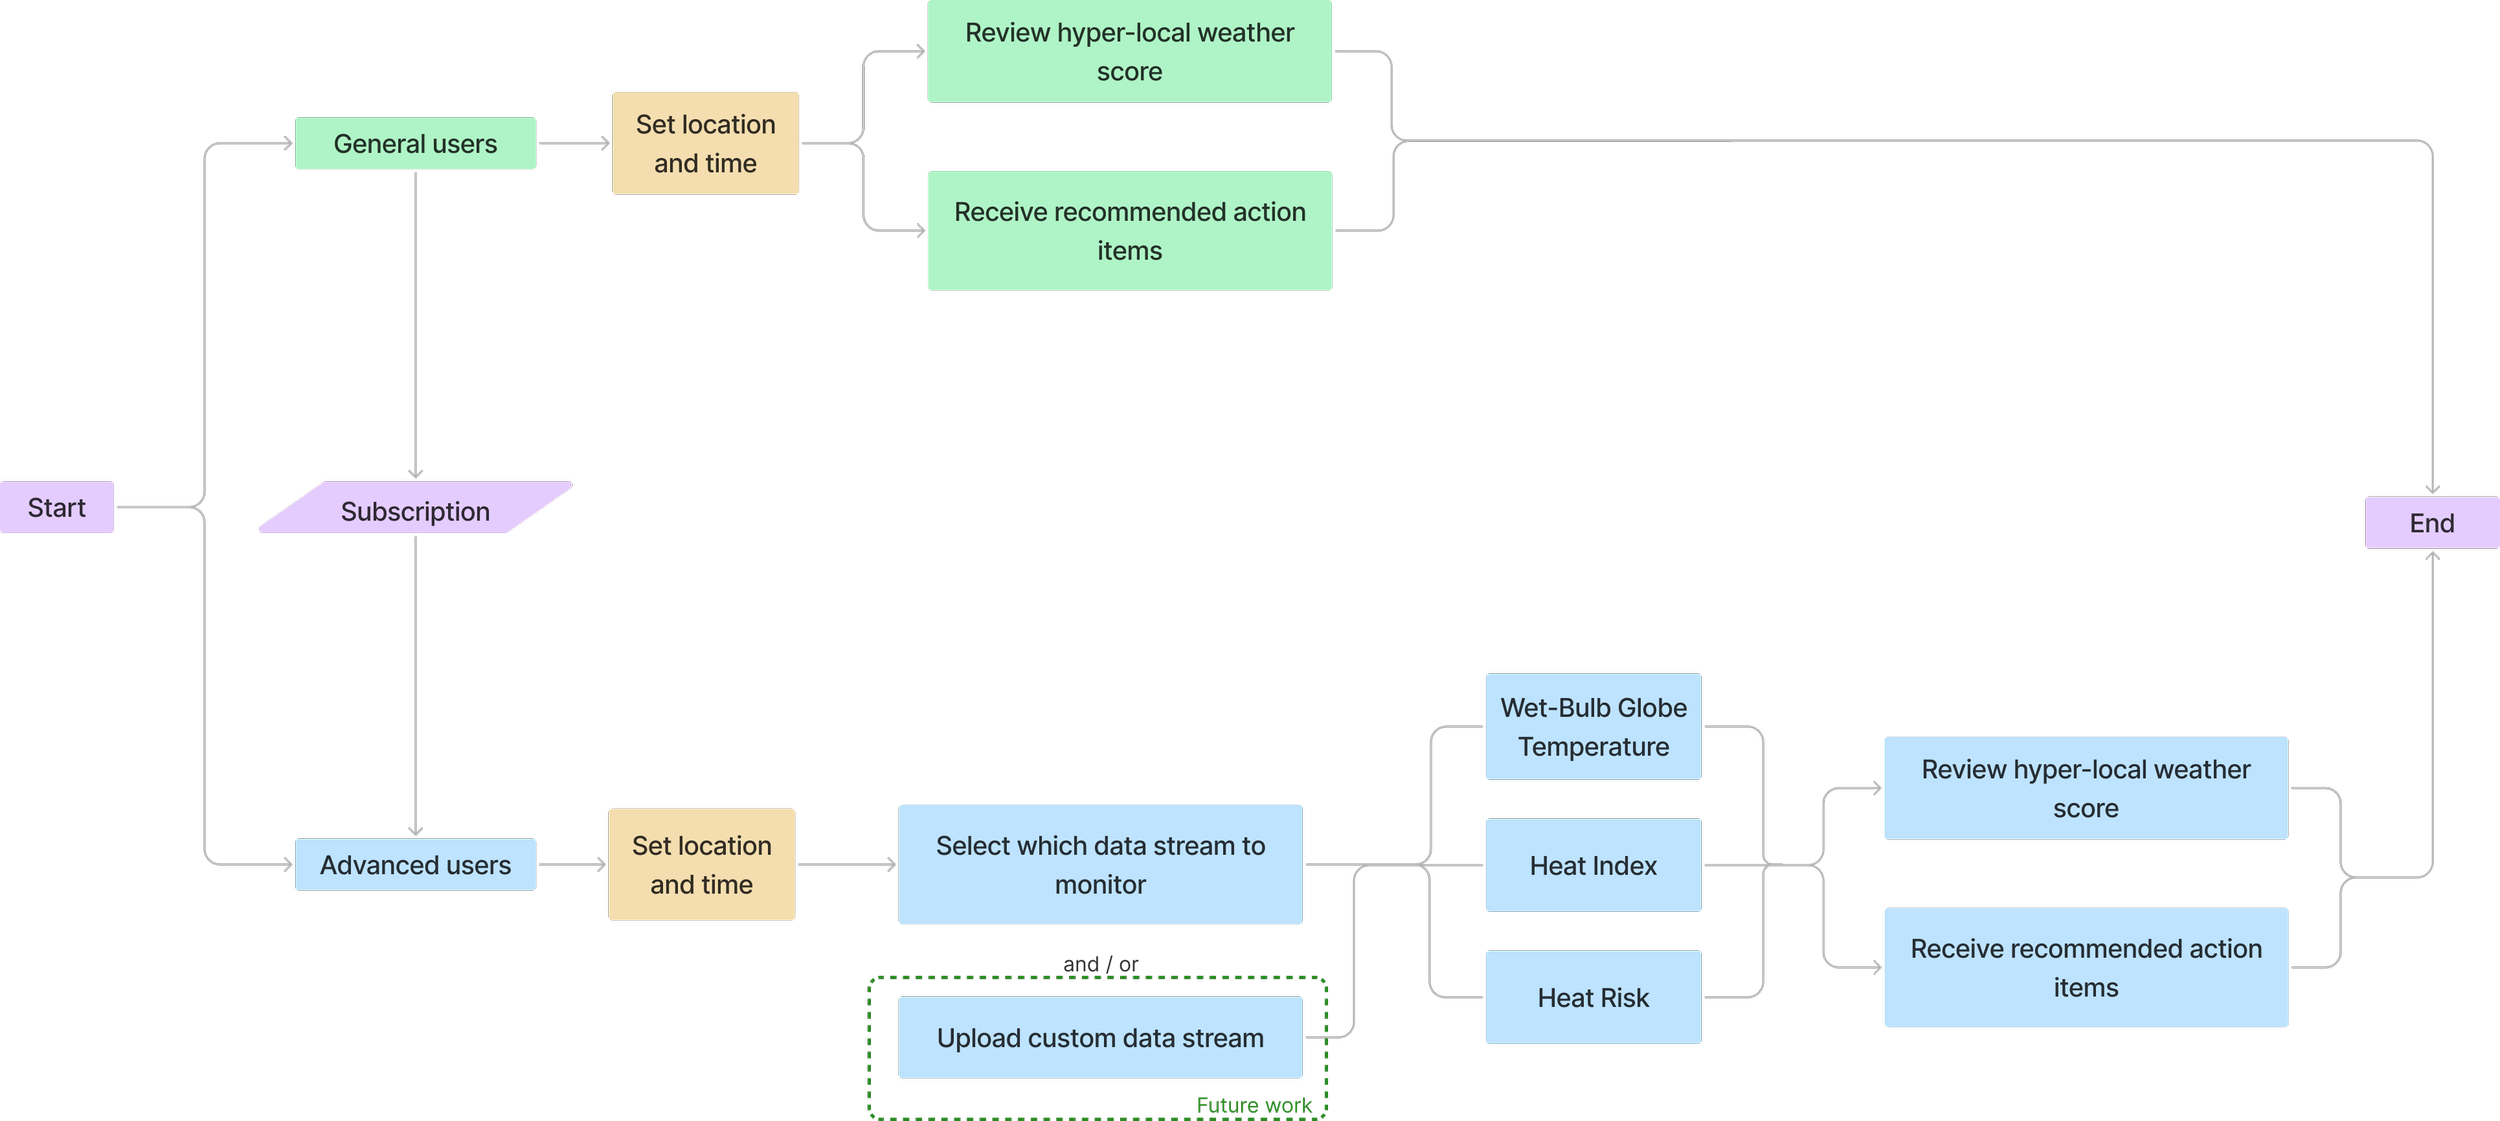
Initial User Flow
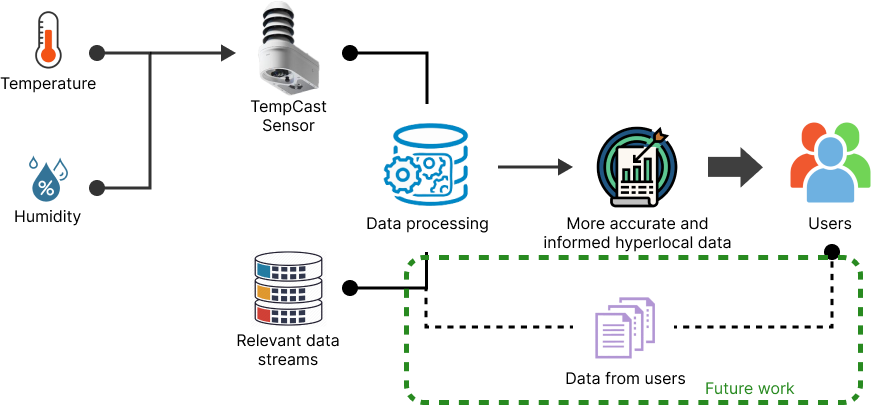
System Diagram:
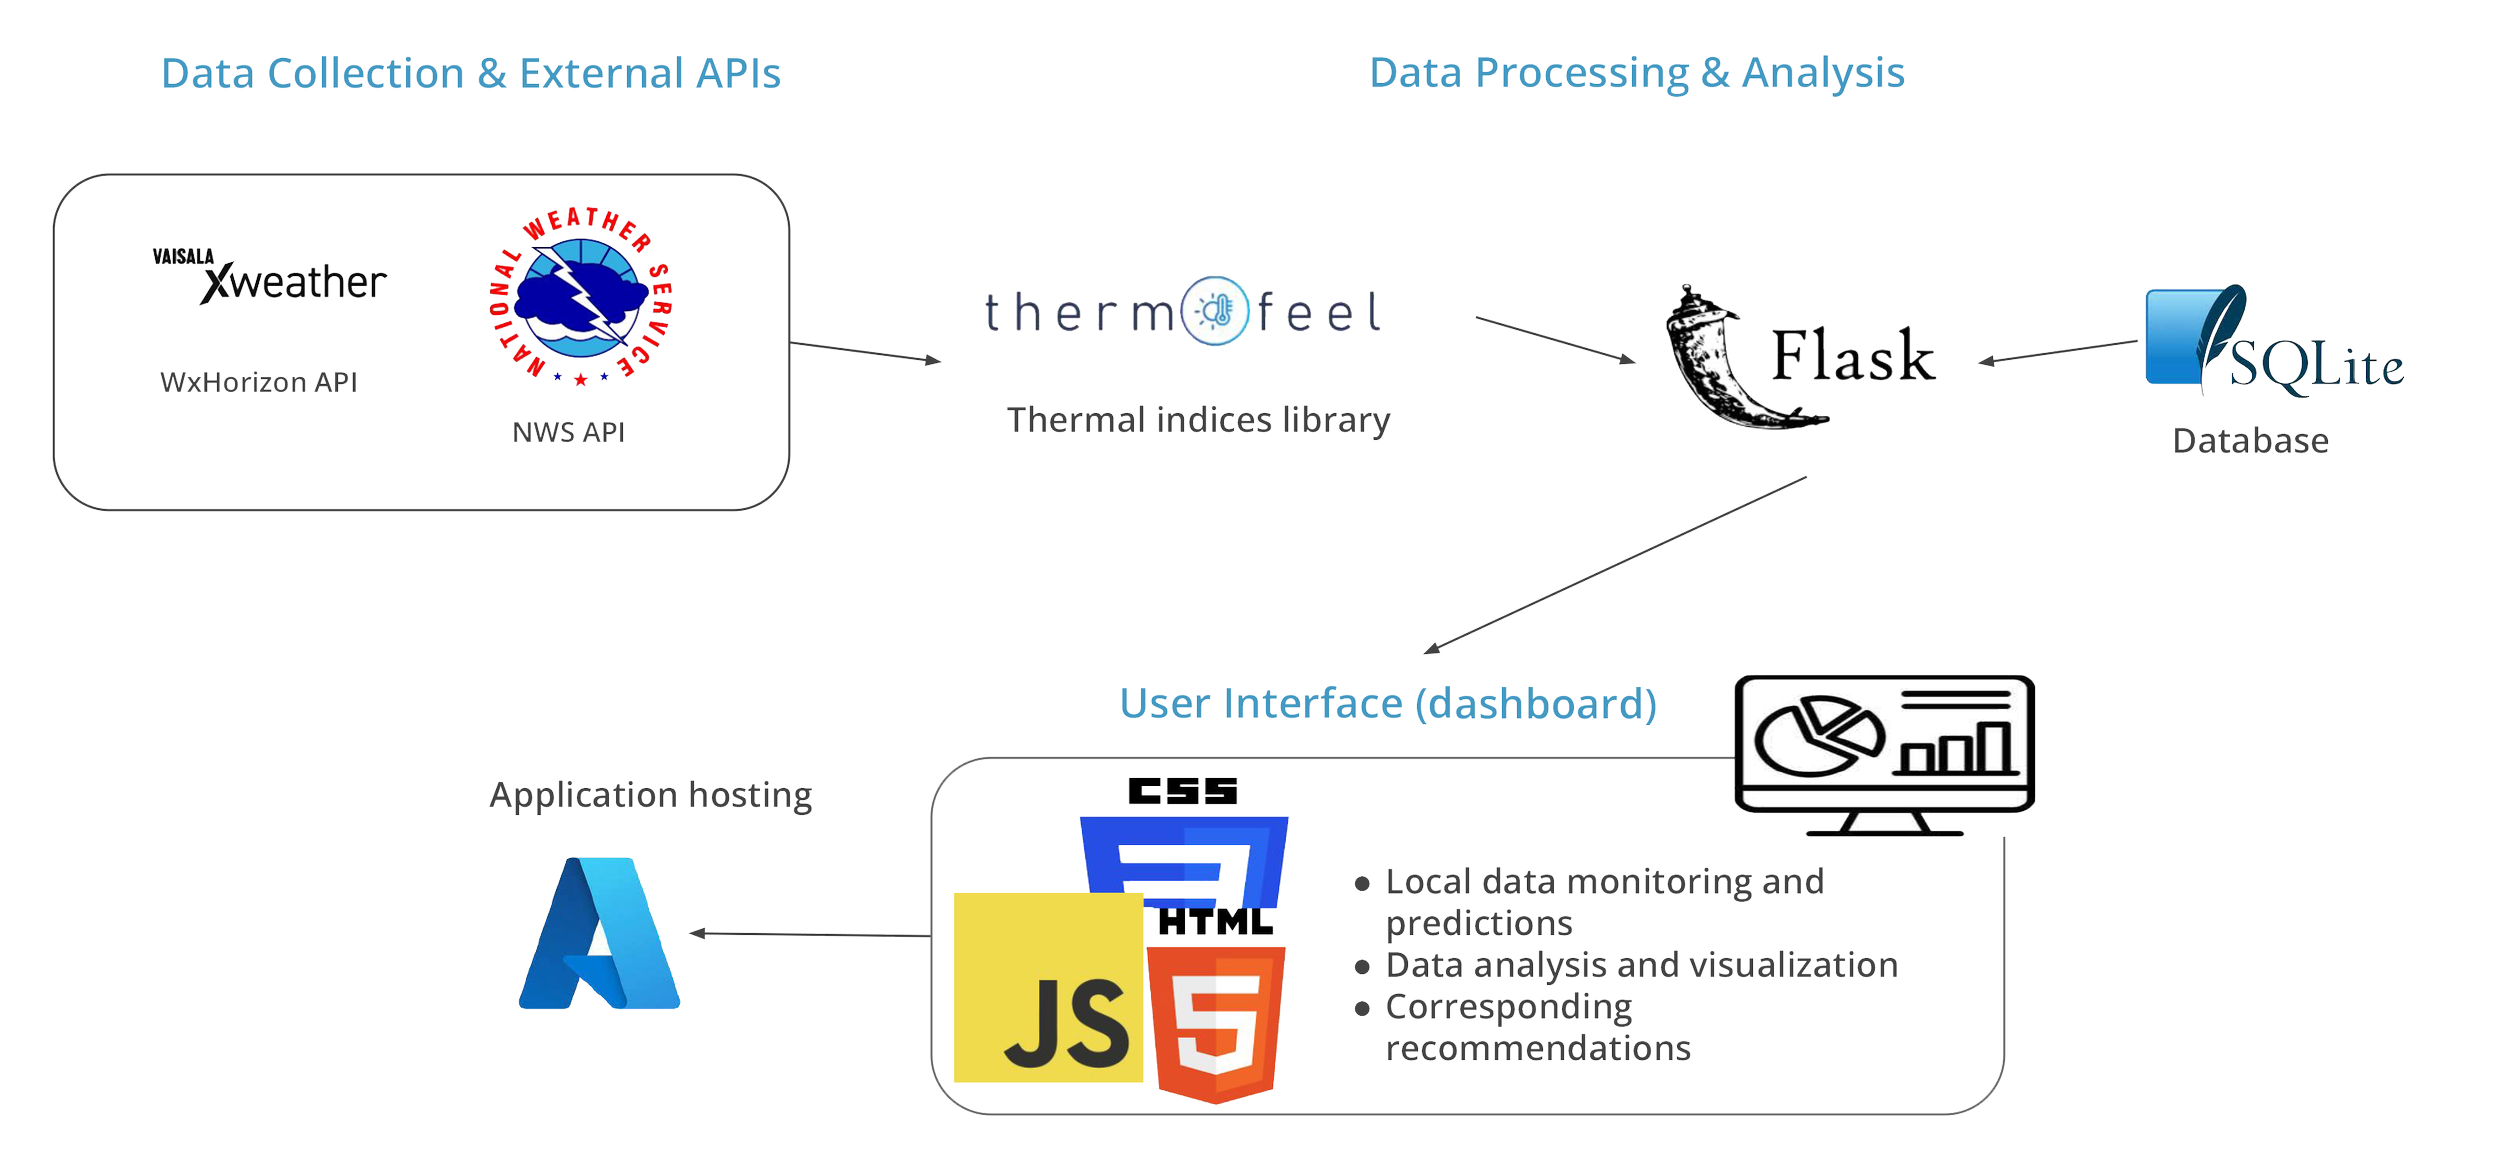
Software Architecture Diagram
Ideation
Through various connections, we were able to consult with industry experts at UW Emergency Management
and the Environmental Health & Safety Department. Their insights and suggestions were instrumental in refining
our dashboard. Additionally, role-play testing simulated end-users’ perspectives, allowing us to observe interactions with the dashboard and address easily overlooked improvements.
Evaluation
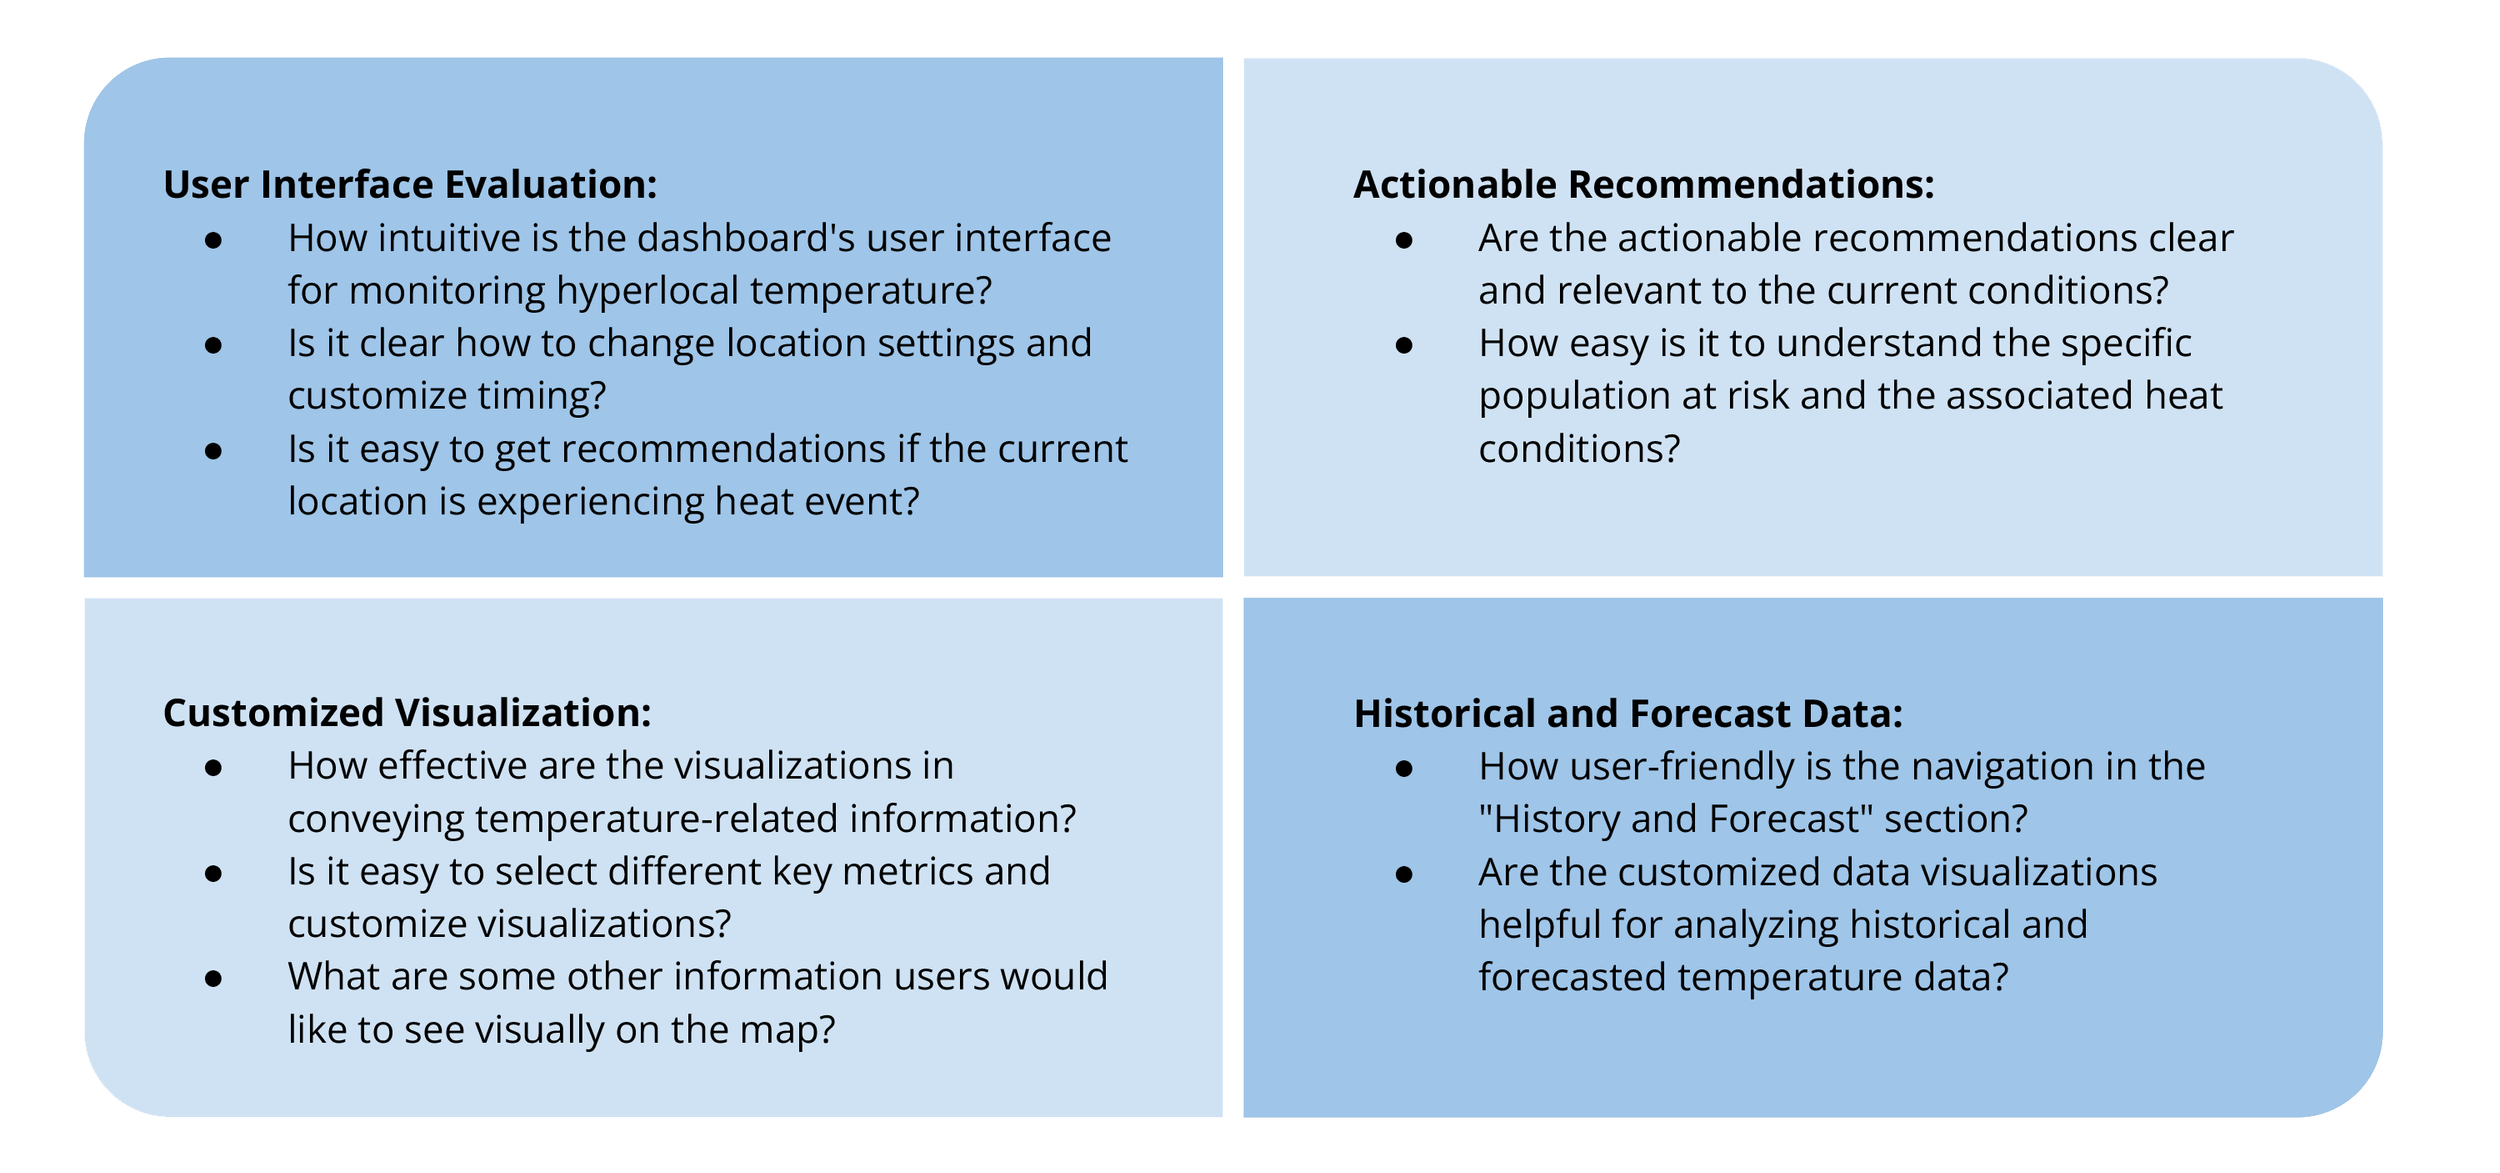
Research and Design Questions:
Results of the Prototype Evaluations:
Users need the most straightforward way to receive hyper-local weather information to make more informed decisions.
Some industry-specific terms such as Wet-Bulb Globe Temperature is not commonly known by everyone.
Instead of understanding the details of the hyper-local weather, users prefer to get actionable recommendations.
Evaluation Summary:
Revised User Flow
Final Prototype

